I’ve just tried interactive plotting using matplotlib and it works fine for me on Windows. I just had to switch to WXAgg backend.
Setup:
pip_install("matplotlib wxPython")
Example interactive plot using matplotlib:
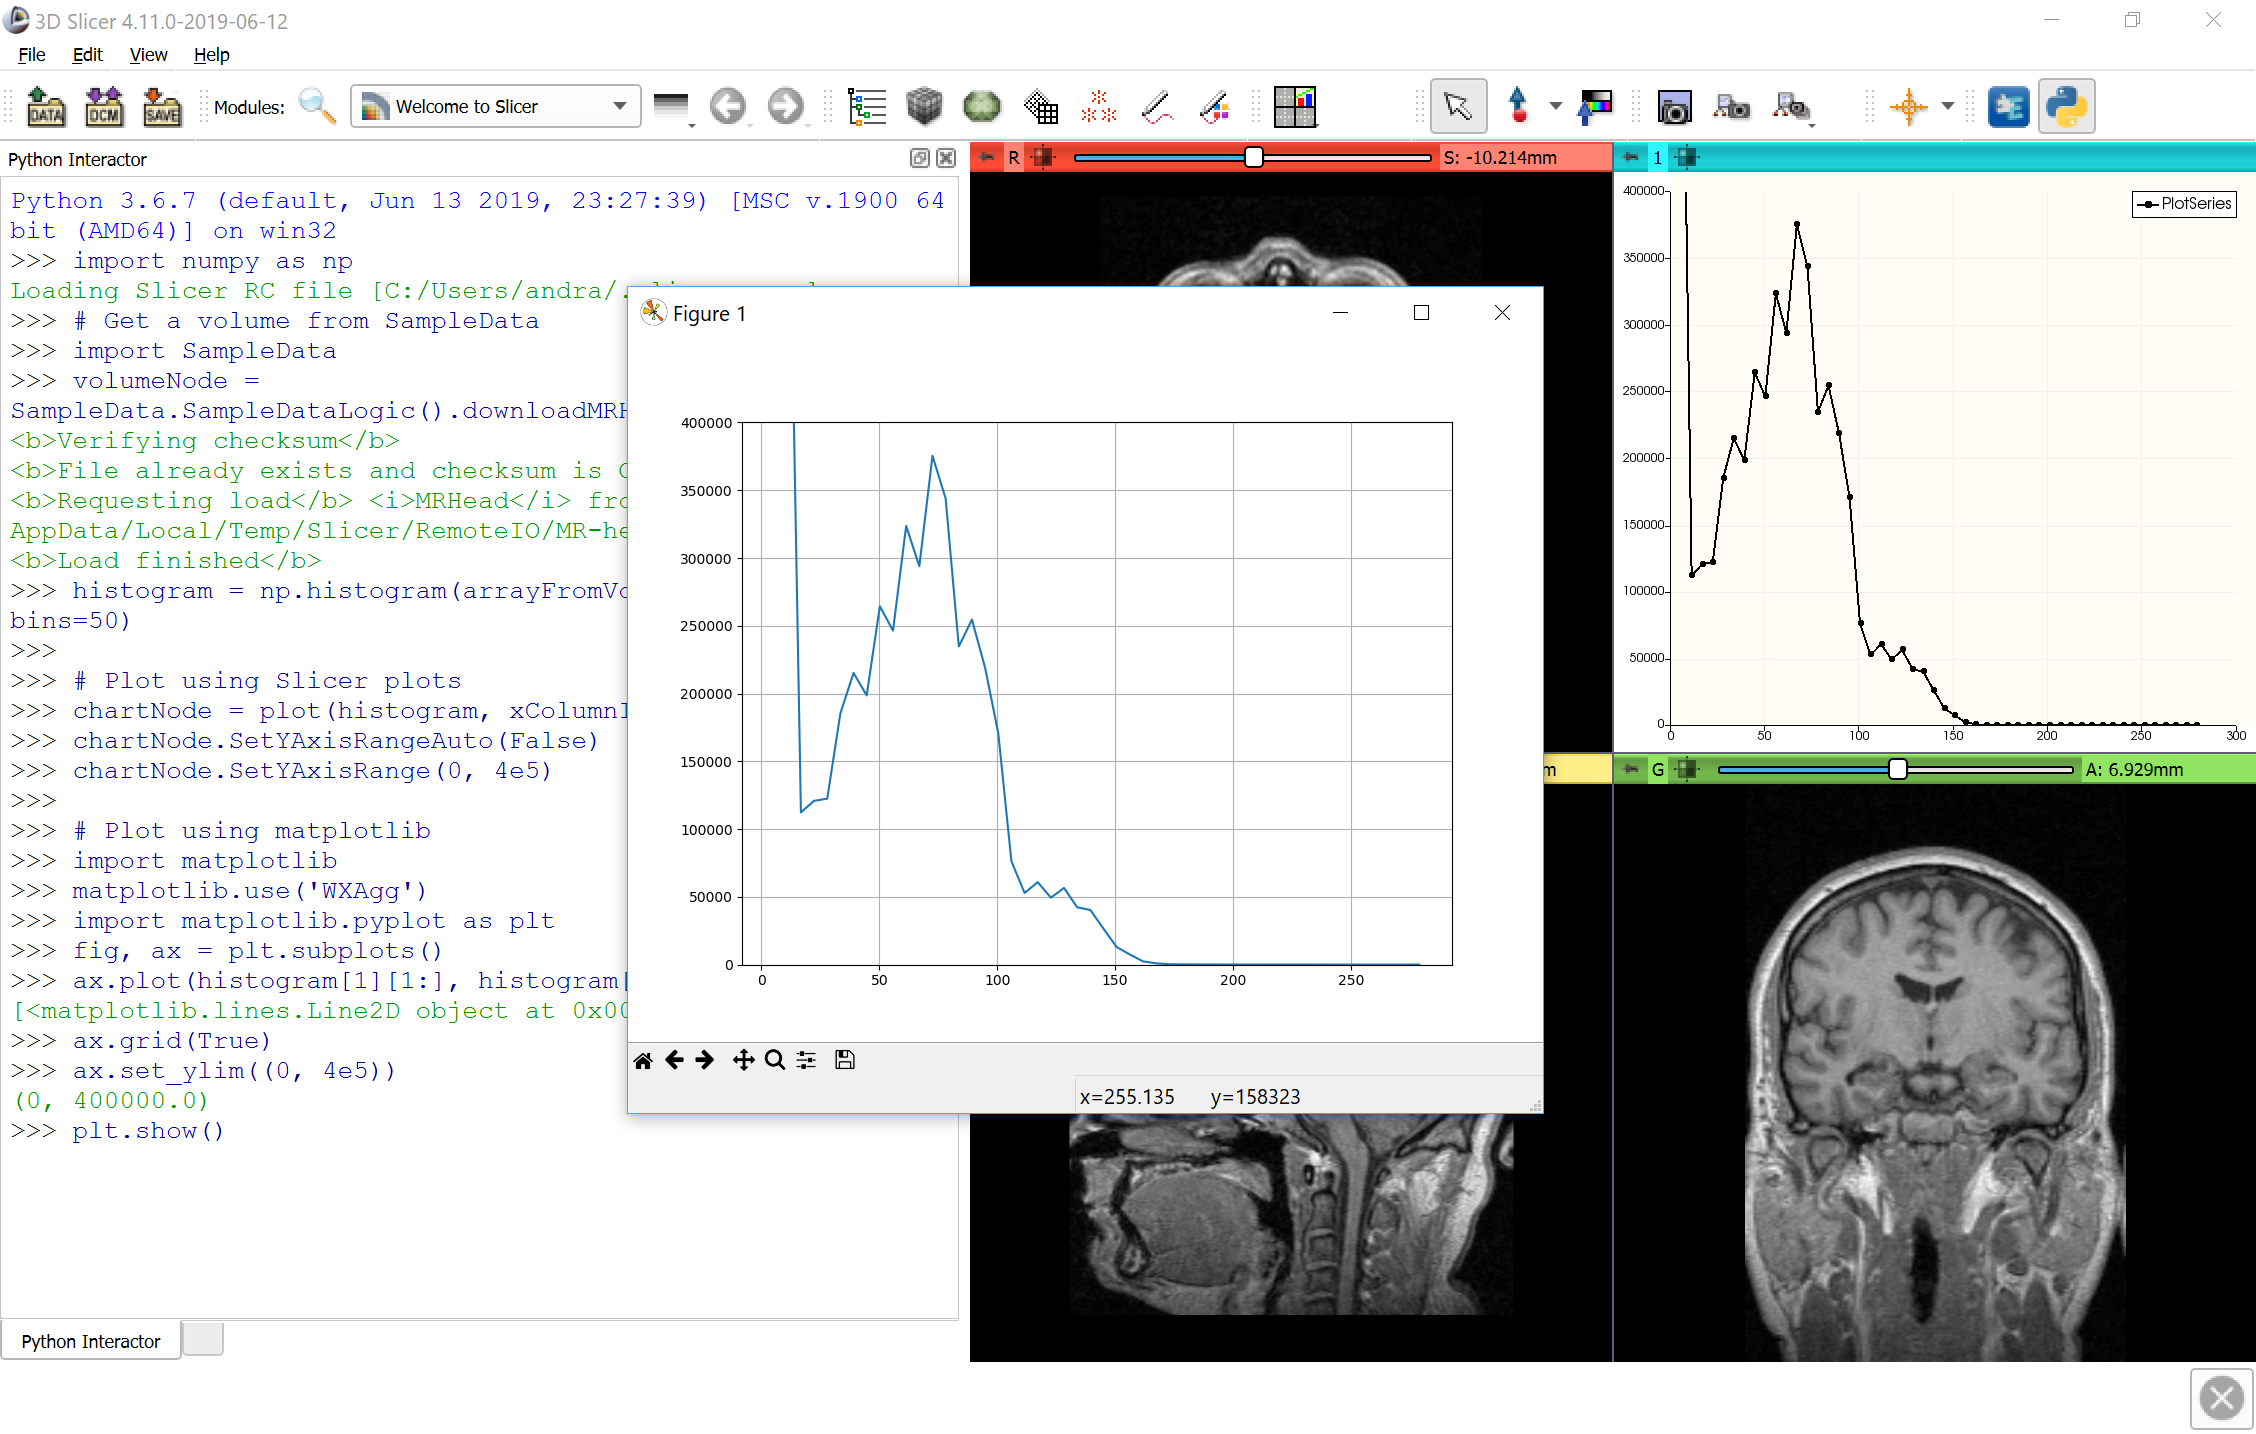
# Get a volume from SampleData and compute its histogram
import SampleData
import numpy as np
volumeNode = SampleData.SampleDataLogic().downloadMRHead()
histogram = np.histogram(arrayFromVolume(volumeNode), bins=50)

# Set matplotlib to use WXAgg backend
import matplotlib
matplotlib.use('WXAgg')

# Show a plot using matplotlib
import matplotlib.pyplot as plt
fig, ax = plt.subplots()
ax.plot(histogram[1][1:], histogram[0].astype(float))
ax.grid(True)
ax.set_ylim((0, 4e5))
plt.show(block=False)
For reference, to create a similar plot using Slicer’s plotting infrastructure:
chartNode = plot(histogram, xColumnIndex = 1)
chartNode.SetYAxisRangeAuto(False)
chartNode.SetYAxisRange(0, 4e5)