Problem report for Slicer 4.11.20200930 win-amd64: [in dicom the older versions showed a better table with series date ] I can not control the table width, no series date
You can now control what fields you want to show in the DICOM browser, what order, format, sorting, and width. This also means that if open an old database then it might be possible that column setup is taken from there, which is not ideal (has the problem you described). I would recommend to create a new DICOM database and import your data sets again. It should just take a few minutes. Let us know if you encounter any problems or need hp with customizing the columns.
the problem still exists, I think there is a bug, I am happy to continue my work in slicer 10.2. as Dicom table looks like this, also I could control the table columns width. I am using windows version slicer10.2
Do not use Slicer-4.10.2. The DICOM browser in Slicer-4.11.20209030 is vastly superior.
You can. Drag-and-drop the right side of any wide column. By default these are the manually resizable columns (the others are either very short, so there is no need for manual size adjustment; or very long and so it is set to use the maximum remaining space):
Patient: Patient ID, Last Study Date, Date added
Study: Study ID, Date added
Series: Date added
Column resize is not enabled by default for other columns because it should not be necessary (there is one auto-fit column that takes up the unused space). If you want to try if you prefer manual resizing then copy-paste this into the Python console, for example for series description:
Study date is a type 2 (required) field, it is already shown by default in Study table
Series table is already crowded with several new, very informative fields (Size, Count, Date added), therefore adding more fields would make leave less space for Series description
Anyway, you can customize all the columns to make it fit your workflow. For example, run this to show the series date column:
Column visualization preferences are stored in the DICOM database, therefore you need to set it only once. Also if you use a separate DICOM database for each project you work on, you can use a different column layout for each. You can find many more examples of how to customize columns in the script repository.
I ran into the same issue, many years ago, and here we are - 5 years later, and fortunately I remembered this strange UI trick to help @rkikinis who was confused the same way as me and as @Ash_Alarfaj (and also by another user in this thread New DICOM browser is ready - #13 by lassoan)… Sorry, but this is not a good UI design.
This is standard spreadsheet/table editing behavior, but I agree that it is not intuitive. A better behavior would be to make the field shorter, fixed-size, and more readable (e.g., “just now”, “5 minutes ago”, “2 hours ago”, etc.) but that would require some design changes in CTK (what we display would not be the same as the value in the database). I would not invest time into this now, as @Davide_Punzo will make the patient list in the reworked visual DICOM browser much better than this.
You can use the same issue to provide feedback, it would be very welcome!
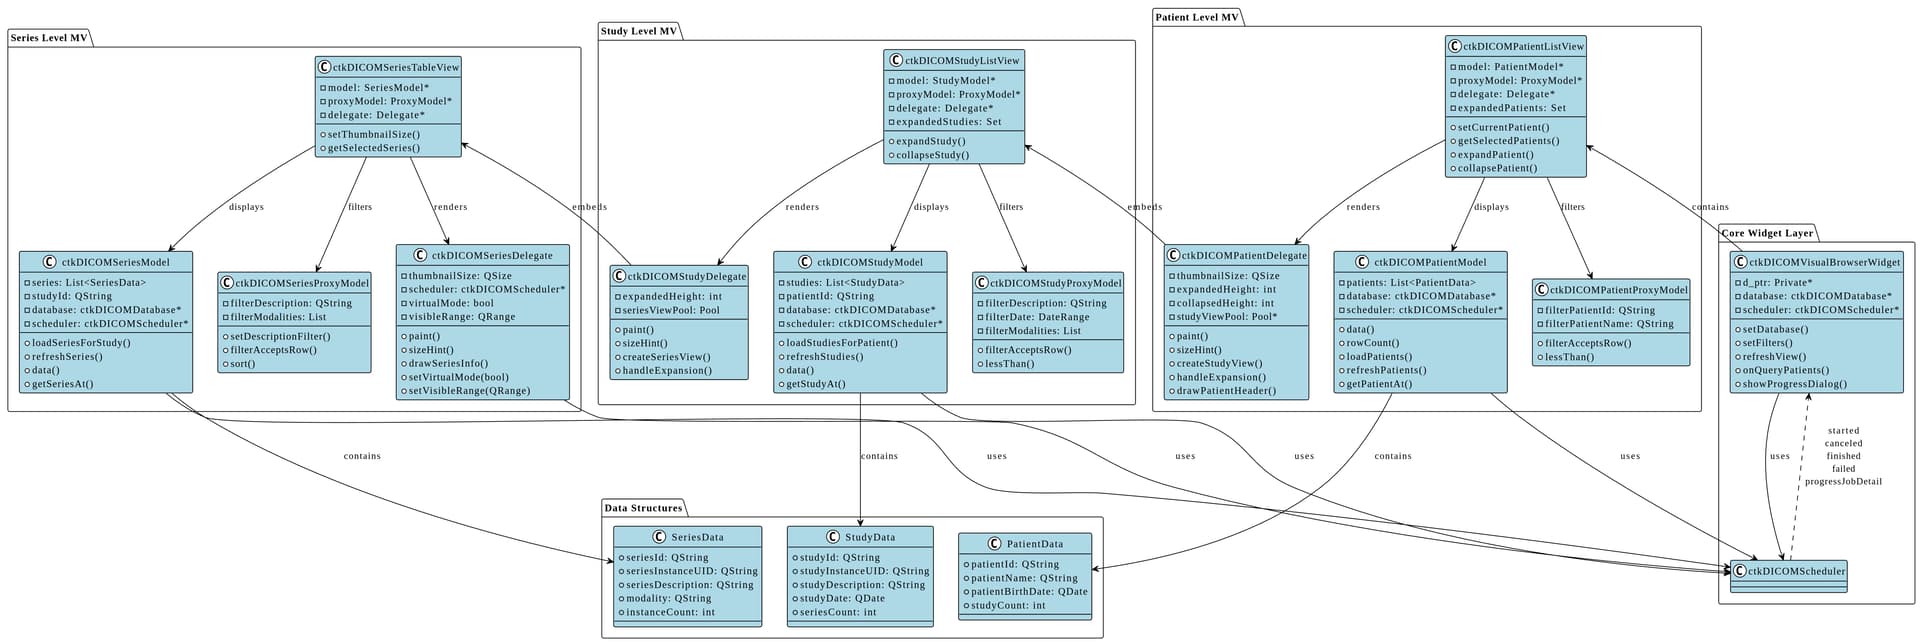
At the same time, I am currently working on a full refactoring of the UI. The previous widget-based implementation had several limitations both in UI design and perfomances. I am switching into a model/view/delegate design which solves the perfomances issues for large datasets and it will also allow me to fully customize the UI (for example the patient tab was really not optimal).
As soon as I have the new implementation (probably in few weeks) I will create a PR in CTK/Slicer and it will be very nice indeed to receive feedback.
The UI at series and study levels will not change too much (but the PR will improve on a lot of small things), while at patient level will change. I will share screenshots asap.