pydevd_pycharm.settrace(‘localhost’, port=4567, stdoutToServer=True, stderrToServer=True)
Waiting for process connection…
Connected to pydev debugger (build 193.5233.109)
Expected: %s to exist.
None
You don’t run code. Slicer runs code that are in scripted modules or that you type in the Python console and if you put a breakpoint in the code then you can do step-by-step debugging from there.
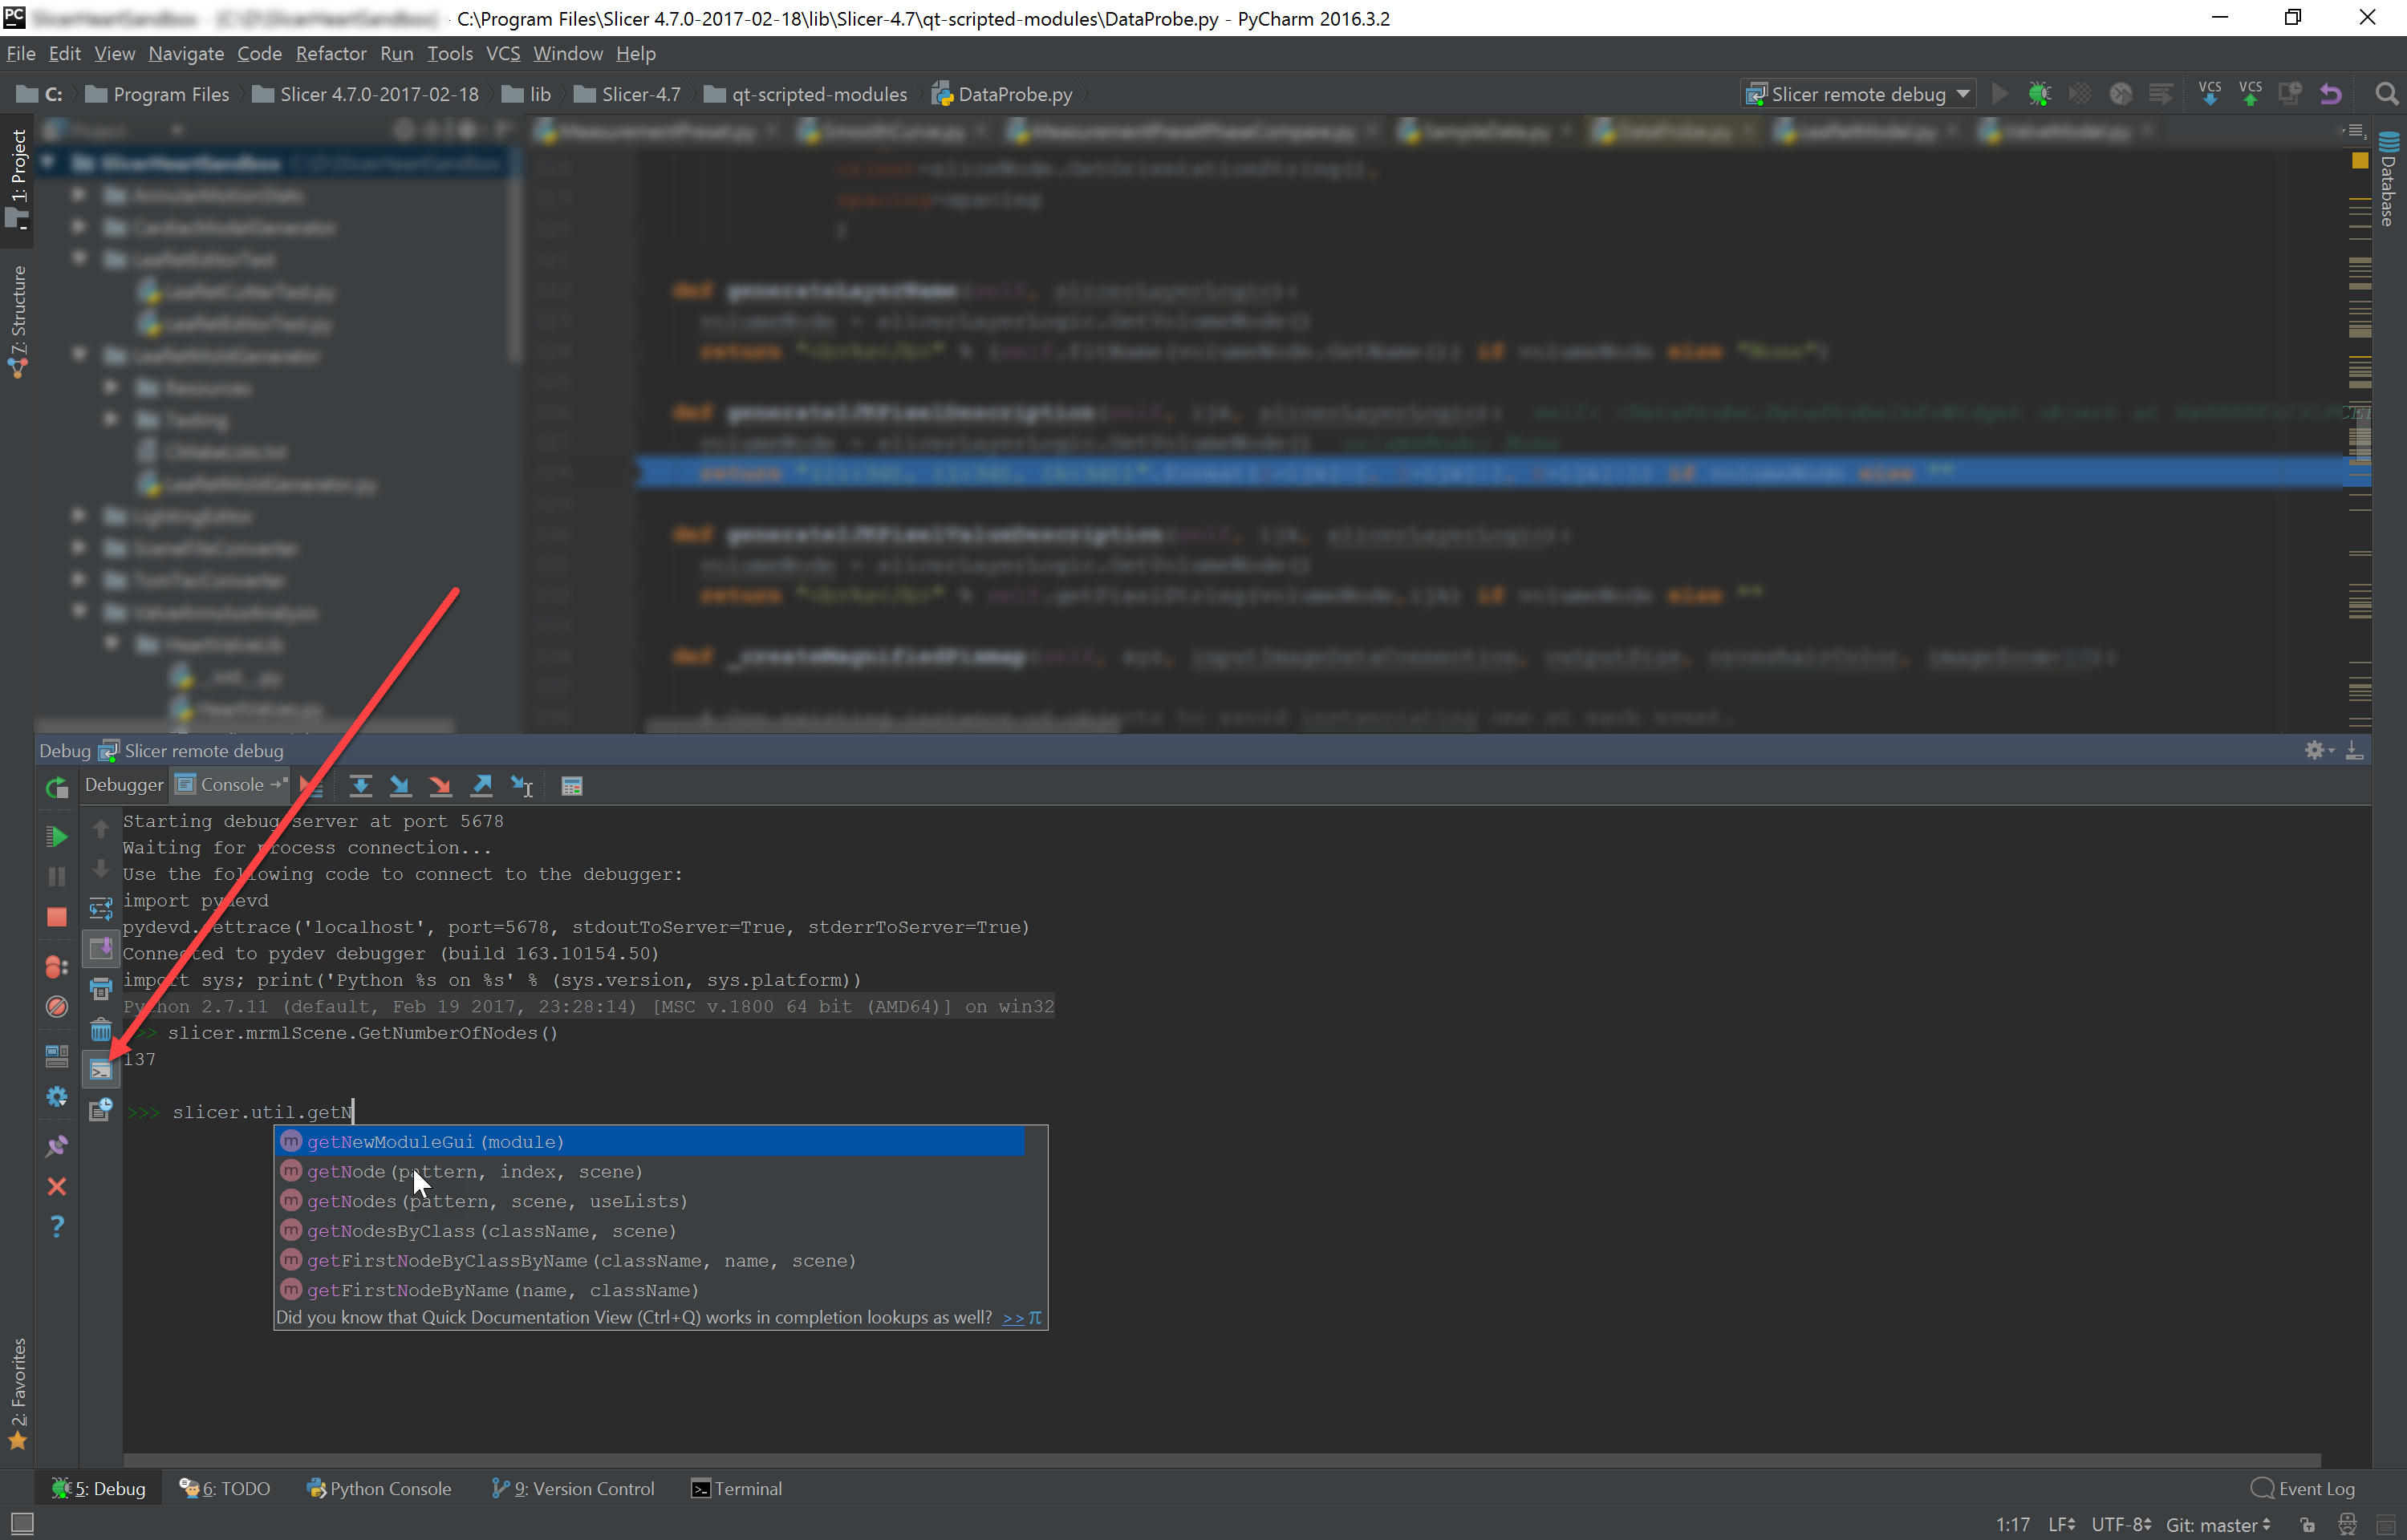
It seems that you missed this step described in the instructions page: “Important: once Slicer is paused at a breakpoint, you can open a terminal, where you can enter Python commands (you have access to all Slicer variables, it has auto-complete, etc). Click the small terminal icon Show Python Prompt to open the Python console.”
If you click that button (the second from the bottom) then the output window turns into an interactive Python console.
I am now able to manually type into the PyCharm python console after pausing the program.
However, I have no idea how to debug a script. All I can do now is to copy the code one line by one line every time I want to run something.
Could you please let me know, how could I run a script while being able to debug with breakpoint without using extension wizard introduced in the tutorial example?
Copy-paste code line-by-line to the Python console in Slicer
Use SlicerJupyter module to use Slicer as a Jupyter kernel. No need to copy-paste, you can run a cell at a time (it is easy to split/merge cells). You can combine this with method 1.
Put your code into a Slicer module (you can change the code without restarting Slicer: save the changes then save the file hit Reload button in Slicer) and insert a breakpoint where you want to start step-by-step debugging. You can combine this with method 1 and even method 2.
To use PyCharm for debugging, is the “Extension Wizard” under “Developer Tool” the only way to add a new Module? And is it also the only way to debug a script in PyCharm?
Creating a skeleton module (where you can copy-paste your script into) using Extension Wizard should not take more than a few minutes. Doing manually would take more time and would be more error-prone, so I would recommend using Extension Wizard. You might be able to run script from a file manually (using importlib), but reloading might be a bit tricky, and again, this is simpler using the module template, which shows a Reload (and Reload&Test) button, which reloads the file by a single click.