I’m looking to take FreeSurfer segmentations of the hippocampus and identify any pre/post intervention changes in shape. I’ve gone through the very nice tutorial on getting SPHARM run on all my segmentations and I’ve gotten the SPHARM Shaple Analysis Module to run through cleanly.
But, I’m having trouble moving past this for group-level analysis. I’ve found the GROUPS tutorial PDF (I should note that the main salt.slicer.com page has an incorrect link) and it’s helping, but I’m not there yet. In particular, I’ve gone through and put down several fiducials on all my hippocampi, but I’m a bit lost on where my “Common unit sphere” is supposed to have come from. I believe the “Input Models” is the “Step3_ParaToSPHARMMesh” folder that’s created and my “Input Fiducial Files” is, of course, where I have those .fscv files I made with the Markups tool. But, I’ve clearly missed a step or more between the Shape Analysis Module and running a group analysis as even that first step of rigid alignment is hanging me up.
This might all be a good bit easier to work through if I could find the tutorial data that the PDF refers to (Summer2018/GroupsTutorial). Is that available somewhere? That and/or any other guidance on moving forward would be greatly appreciated.
I have corrected the tutorial links in the salt.slicer.org page. Thank you for pointing that out.
GROUPS right now is just a way to adjust and optimize the SPHARM-PDM parameterizations to account for population information. The regular SPHARM-PDM computation only takes into account the geometry of each single case and that at times is insufficient.
If you refer to the option to do group statistical comparison and hypothesis testing based on shape, that module will be integrated into SALT as soon as Slicer finalizes the transition between Python 2 and Python 3.
We will make an announcement when it is ready, hopefully very soon.
Thank you!
Hi @bpaniagua!
I was also interested in the GROUPS analysis, as it seems like a lot of the other group based analyses no longer work/are out of date from the other forums.
Has this been updated yet?
Thank you!
Tom
GROUPS is not a group difference analysis tool, but rather a group-wise correspondence optimization. Basically, it improves upon the SPHARM correspondence to generate a better one and thus any subsequent analysis would be more sensitive (see also [1,2] for the methods on GROUPS).
For the statistical analysis, SlicerSALT has a group comparison/analysis module called “Covariance Significance Testing” (internally named MFSDA). There is also a module called “Population Analysis” (internally called Shape Variation Analyzer), which allows you to do PCA analysis and inspection of PCA shape spaces.
Martin
Lyu I, Perdomo J, Yapuncich GS, Paniagua B, Boyer DM, Styner M. Group-wise Shape Correspondence of Variable and Complex Objects. Proc SPIE Int Soc Opt Eng. 2018 Mar;10574. PMCID: PMC6205236
Lyu I, Kim SH, Seong J-K, Yoo SW, Evans A, Shi Y, Sanchez M, Niethammer M, Styner M. Robust estimation of group-wise cortical correspondence with an application to macaque and human neuroimaging studies. Frontiers in Neuroscience. 2015;9:210. PMCID: PMC4462677)
Dear Martin @styner,
Thank you for the speedy reply, that makes much more sense now, thank you!
I’ve had a pretty thorough search of the Slicer Docs and a quick google search but I can’t find any documentation on MFSDA/ covariance significance testing or how to use it. Is there one of those wonderful google slides presentations for this module?
Thanks for your help!
Cheers
Tom
The MSFDA tutorial is currently being developed (hopefully soon) but what you need to run the Covariance Significance Testing is a file with all your covariates per shape and a shape where you want to map the p-values, alongside, of course with your correspondent geometries from SPHARM (or other shape modeling method)
You havean example here, where you can see the file formats and what you need to run the module.
Let us know how it goes!
Bea
ps. The only functionality of what we call GROUPS in SALT is the ability of solving SPHARM-correspondence ambiguities by providing expert landmarks, so it is a correspondence optimization method as Martin said, not a statistical shape analysis method. It is though very useful when you have shapes where correspondence is known by the user but not trivial by just looking at the geometry (symmetries, etc) HTH!!
Thanks for the info!
I had a go at it, and got some nice results now, though I think I should run my data through GROUPS first to solve some of these correspondence ambiguities.
A couple of things:
How can I create a spherical template for the groups I wish to compare?
I’m assuming my “shape for p-values” should also be an average shape that represents both of my samples?
Do the input shapes need to be in the same physical space (i.e., do I need to register them beforehand)
Is there a FWE correction applied?
What do the beta values and para values mean in the ‘Attribute’ section of the ShapePopulationViewer once I have my result? Do I look at these or the p-vals or both (new to shape analysis here).
There’s also a small bug in the Covariate Significance Testing module of Slicer Salt (run on windows, latest versions etc.) When I load one CSV into the module, then load another one, it concatenates both of the CSVs. I have to restart SlicerSALT whenever I want to run it with different groups.
Thanks for your replies, now that it is all working I am seeing the light! Thanks for the great tool
Cheers,
Tom
How can I create a spherical template for the groups I wish to compare?
The spherical template is the vtk of the spherical parameterization (*pp_para.vtk) from an specific case that you want to replicate in the rest of the population
I’m assuming my “shape for p-values” should also be an average shape that represents both of my samples?
That’s correct.
Do the input shapes need to be in the same physical space (i.e., do I need to register them beforehand)
Yes. If you use the procalign option in SPHARM, the module will output the procrustes aligned correspondent meshes.
Is there a FWE correction applied?
I believe so, yes.
What do the beta values and para values mean in the ‘Attribute’ section of the ShapePopulationViewer once I have my result? Do I look at these or the p-vals or both (new to shape analysis here).
The beta values will be the magnitude of the difference, the p-values will be the significance of the difference. I would visualize mainly the p-values to see when the shape differences are significant, and confirm with beta maps when necessary.
Thank you so much for your answers above (and Martin as well!; and sorry for the delay in my answers - I was out of office).
I followed your suggestions and all seems to be working now, thanks!
I have another question:
I might be misunderstanding, but if I want to do a group analysis (e.g. see where on the mean shape group 1 differs from group 2) isn’t it useful to use the spherical parameterisation of a “mean” subject instead of 1 specific case?
Hi Jasper,
You are partially correct. I.e. our information needs to be corrected.
It’s less about 1 specific case or the mean, as all surfaces after SPHARM reconstruction have the same spherical template (i.e. the same spherical sampling). Thus the mean and the individual subject have the same spherical template. This is not to be confused with the parametrization of the original surface (as opposed to the SPHARM reconstruction), which is different for each surface.
To recap:
the “*pp_surf.vtk” and “*pp_para.vtk” are the original surface and its spherical mapping. These are different across surfaces and do not use these for statistics modules.
the “*pp_surf_SPHARM.vtk” and “*pp_surf_para.vtk” are the SPHARM reconstruction and the spherical mapping of that reconstruction. The “*pp_surf_para.vtk” are all the same for all surfaces/subjects. SALT generates this para.vtk for all surfaces, and you can safely delete all but one of these (keep one for the Covariate Significance Testing module).
Hi Tom @thomshaw92:
Thanks for asking this question cuz I feel like a lot of people are still confused by this Covariate Significance Testing module. Could you please detail what file format did you use for each entry?
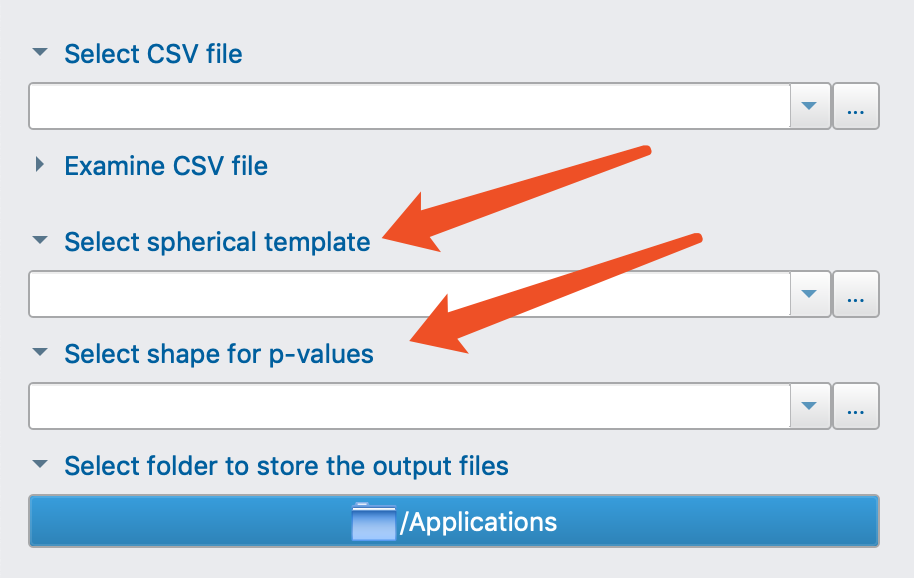
Select csv file
I assume this should be a csv file containing TWO columns. The 1st column is the path-to-vtk files, and the 2nd column is the group index (like 0,1).
Select spherical template
I used mean model generated by Population Analysis module but anyway it’s a .vtk file.
Select shape for p-values
I am totally confused here and I have no idea what should be put here. So I just used the same file as entry 2, the mean model.
And finally I only got a output.csv file with nothing else. From that one example provided by Beatriz @bpaniagua (Thanks Bea!) the output should contain 4 files.
I don’t know how to make this correct. Could you please give some suggestions? Thanks a lot!
Hi @bpaniagua, what is the procalign option in SPHARM? I can’t see it. Is this the “Use Reg Template” option? If so, is my reg template (Mesh file) going to be a sphere or just a randomly chosen exemplar from my sample?
I was thinking of first registering my samples together (volumetrically using ANTS) and then creating an “average” mesh as my “Reg Template (mesh file)”, is that sensible?
Thanks again for your help!
See Martin’s response above. I didn’t use the population analysis module because it does a different thing.
For this one you need an examplar image (one produced by SPHARM) that isn’t a sphere (it’s the shape that you are comparing between groups).
I had a bit of trouble making it all work, double check manually that the files in your CSV exist, I can see you have over 350 shapes that you are comparing and mine would always crash if one didn’t exist.
I’m by no means the expert here though. Hope that helps!
When you guys say shapes, what kind of shape should we put into the Covariate Significance Testing module? SlicerSALT 2.2.1 was used in my project.
I have 2 patient groups and want to compare the shape deformity in hippocampus between these 2 groups.
I have pre-processed all the data using FLIRT (a linear registration tool in FSL) with DOF of 6 (only translation and rotation) so I did NOT use procalign during SPHARM-PDM.
Then, I fed all the *_pp_surf_SPHARM.vtk files (see the pic below) into the Covariate Significance Testing module.
I used the mean shape of all healthy subjects as both the template and the shape for writing p-val. (see pic below)
But then I got, in “pvalues.json” file, “Gpvals”: [[1.0]], “clu_pvals”: [[1.0]], “Lpvals_fdr”: [[0.997606067488982], with a series of pvalues for each point (I feel they are FDR corrected) all greater than 0.997 which means there is no difference of any point between these two groups. But before when using StatNonParaTestPDM, we could detect the differences.
Could you please give me suggestions on where I went wrong?
Notes: I saw from the one example provided by Bea that input vtk files are all ellipsoids. I don’t know where these ellipsoids come from. And, I attached my input csv file here for your reference to see if I have wrongly constructed the csv file. (pos_neg.csv - Google Drive)
Hi Shane
Re 1. Using an external rigid registration of the surfaces instead of rigid-Procrustes is fine (though I think in this particular case Procrustes should outperform flirt in alignment accuracy).
Re 2 & 3. It is not clear what you used for the spherical template. You mentioned you used the mean shape of the all healthy subjects. To use the actual mean surface as the shape for visualizing the p-vals is fine (this is what we are commonly doing too). But, if you used that same surface as a spherical template, then this would not work. Rather you need the spherical surface (literally the unit sphere, just sampled the same way as your surfaces). As mentioned in one of my earlier messages, you need to use the sphere (pp_surf_para) surface of any of the surfaces. These sphere surfaces are exactly the same for all subjects (and thus is the same also for the mean).
Thanks for your answer! Yes, I am also using the Mean as the spherical template. That’s because the input files of mine are not ellipsoids so I used this mean hippocampus shape as the spherical template (in this one example, the input files are ellipsoids and please see the figure 1 below). But my input files are just the *_pp_surf_SPHARM.vtk files which are hippocampus shapes not ellipsoids (please see figure 2 below). Do I need to do some thing to make my input files into the ellipsoids?
Besides, I’ve tried not using FLIRT but using procalign (first applied SPHARM-PDM on the template .nii.gz file and used the template_pp_surf_SPHARM.vtk as the Reg Template in SlicerSALT). But then I found the surfaces were not like in the same direction. A is pointed to the left while B is in the same direction as the template. Do I need to make them like the figure above where FLIRT was used?
Your shapes might be flipped after procalign because there is a flip in the parameterization.
You should look at how the *spharm.vtk meshes with the phi color map look like. SPHARM-PDM has a way to flip them in a consistent way, see more info starting on slide 44 of our most recent spharm tutorial here.