I asked this because you wrote that “I believe that the DVF value of a histogram is…”, but a histogram does not have a DVF (displacement vector field) value. Each histogram value contains the number of values that are in the corresponding value range.
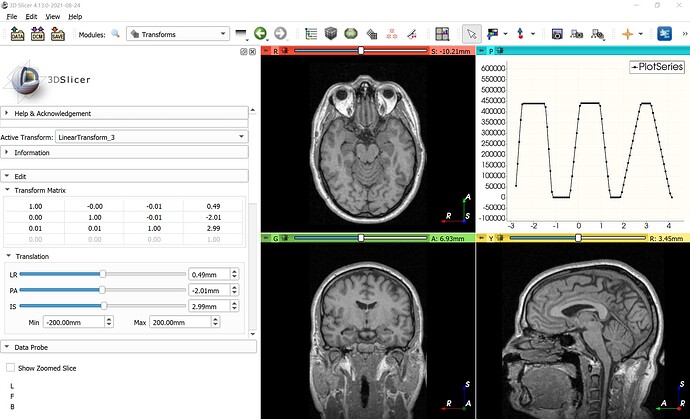
If you pass all the coordinate values to the numpy histogram function then it will simply pool together the values of all three vector components (R, A, S). Probably your histogram above have 3 peaks because displacement vector components are mostly around -2, -0.6, and 0.4.
To give you an example, if you create a transform with a translation around RAS axes [0.5, -2, 3] and add a few tenth of a degree of rotation (just to have some variance in the translation) then you get a histogram like this if you pool all the components together:
volumeNode = getNode('Displacement Field')
import numpy as np
histogram = np.histogram(arrayFromVolume(volumeNode), bins=100)
slicer.util.plot(histogram, xColumnIndex = 1)
Since statistics of all 3 vector components are pooled (thrown into one big list), you don’t know which peak correspond to which scalar component. So, you probably want to compute histogram for each component separately. You can then see the distribution of each vector component separately: R component’s peak is around 0.5, A component peaks around -2.0, S component around 3.0.
range = [-5.0, 5.0]
bins = 100
histogramR, histogramBins = np.histogram(arrayFromVolume(volumeNode)[:,:,:,0], bins, range)
histogramA = np.histogram(arrayFromVolume(volumeNode)[:,:,:,1], bins, range)[0]
histogramS = np.histogram(arrayFromVolume(volumeNode)[:,:,:,2], bins, range)[0]
slicer.util.plot(np.vstack([histogramBins[:-1], histogramR, histogramA, histogramS]).T, xColumnIndex = 0, columnNames=['N', 'R', 'A', 'S'], title='Histogram')
If you want to compute the histogram of the displacement magnitude then you will ignore vector directions and just compute statistics for the length of each vector. These numbers will be all positive. Since vectors are all about [0.5, -2.0, 3.0], the peak will be around 3.6:
magnitudes = np.linalg.norm(arrayFromVolume(volumeNode), axis=3)
histogram = np.histogram(magnitudes, bins=100)
slicer.util.plot(histogram, xColumnIndex = 1, columnNames=['magnitude', 'N'], title="displacement")
Note that all that I described above are just standard numpy functions and basic linear algebra. The only Slicer-specific functions are arrayFromVolume to get the displacement field vectors as a numpy array, and slicer.util.plot to display a plot.


