Thanks for your reply. I mean from the checkerboard images I attached above I can’t really see the second modality to be able to compare the edges to the input modality to see if I have a good registration. Is there any way to make the second input darker or more visible?
Are you saying you made them with the checkerboard filter? I don’t think there’s a way to change the individual window/levels using that module. If you use the layer reveal cursor you can change the window/level of the foreground and background the normal way and also zoom and pan.
Checkerboard filter is a very, very poor visualization method for comparing images. It is one of those methods that only become somewhat popular because it is very easy to implement. The main problem is that you would need large squares to be able to interpret the image, but you need small squares so that you can compare the image contents (because you only see difference at the boundary of the squares).
For example visualizing misalignment using checkerboard with 4, 8, 16 divisions:
Instead, take one image and overlay edges extracted from the other image. You can use Canny edge detector or similar filters if you want to have a general idea about displacements/distortions. You need to first convert the input image to float type (using Cast Scalar Volume module) and then use Simple Filters module to do the Canny filtering (try with lower threshold = upper threshold = 50) or other filtering. You can change the colormap using Volumes module.
But in general, it is even better to segment the structure(s) of interest in one image and display that over the other image. It is also simpler, as segmentations is displayed already overlaid on the image. If you don’t want to segment any specific object then you can use simple thresholding to get a good set of contours.
Thanks very much for the comprehensive explanation. I have the segmentations but my confusion is from having a good alignment when the three views are centered like this:
This visualization using segmentation is very informative. It seems that the femurs are in a different position (slightly more anterior) in the image that was segmented.
If you want perfect alignment of the bones then you will need to do piecewise registration (register each bone separately). You can open a new topic if you want to do that but not sure how.
The labelmap checkbox is an indicator (grayed out, not to be controlled by the user). You don’t need to convert the float-valued Canny edge detector output to labelmap volume, you can simply select it as foreground volume and then configure its appearance in Volumes module (set a lower threshold > 0 to make the background image visible; you may set a different colormap, adjust the window/level).
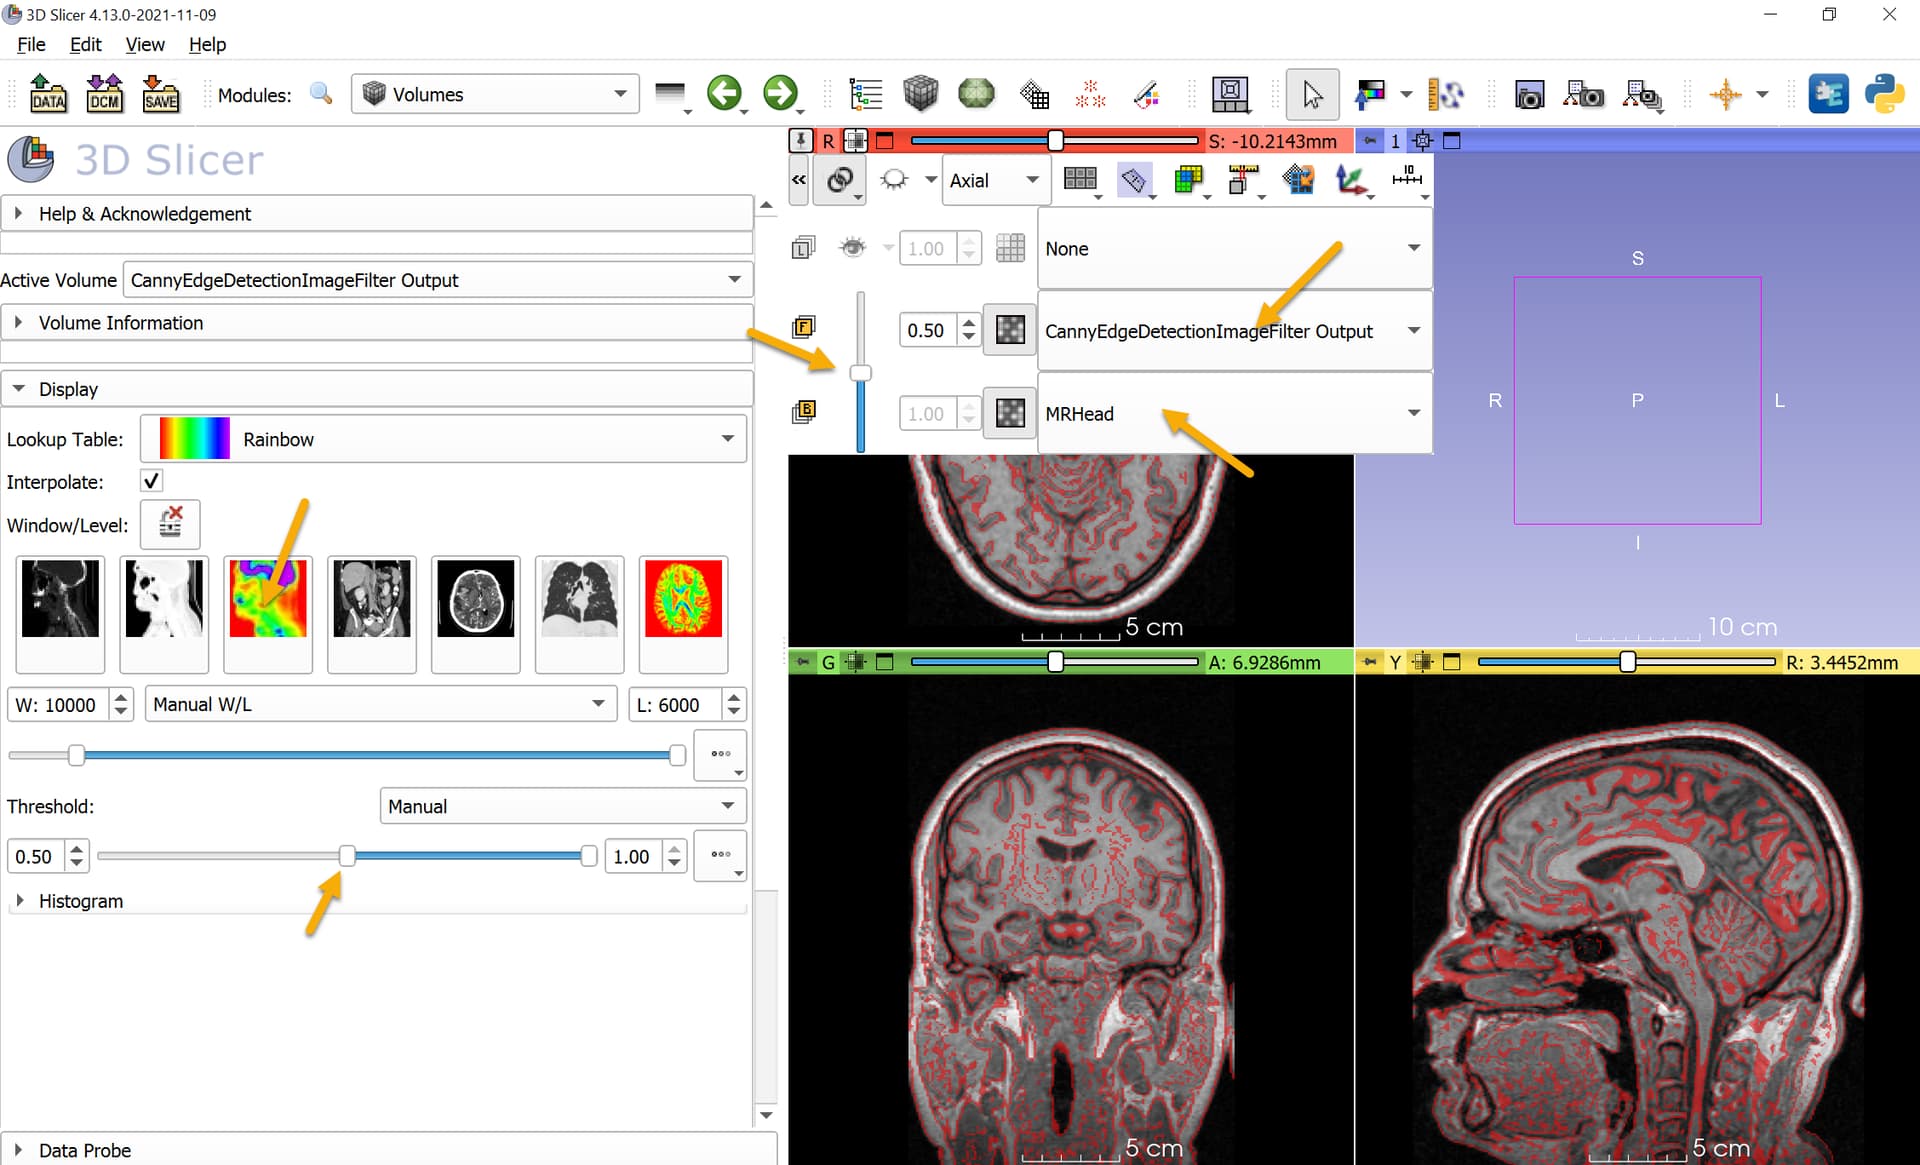
After choosing the grayscale volume as background, Canny output as foreground, foreground opacity to 0.5, and in Volumes module setting 0.5 threshold and a color lookup table:
There have been attempts like this in the past to define a similarity metric based on automatically extracted contours. However, most normally you would evaluate misalignment based on landmark points or segmented surfaces.