Hi,
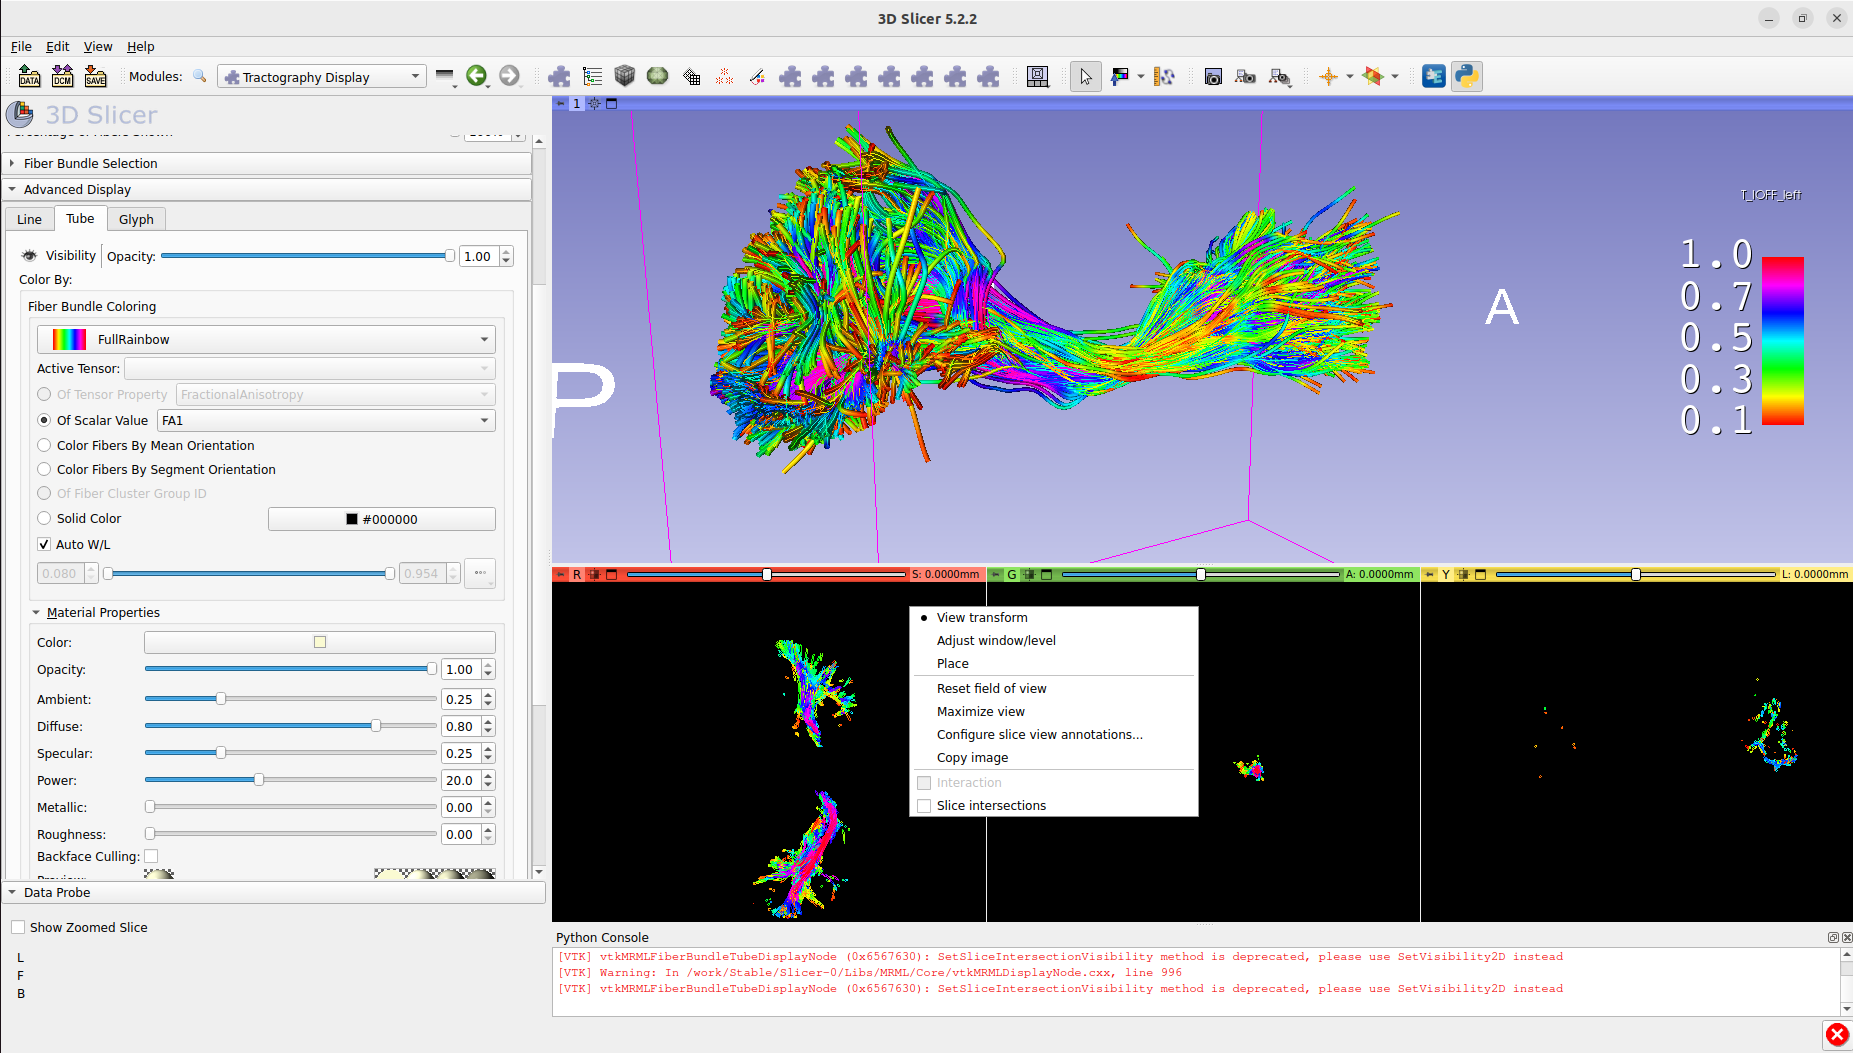
is it possible to add a colorbar across the Slicer viewers (just as shown in the image in this post for another type of data) when we load some tractography data and load an associated scalar map, e.g. FA? If yes, how can this be done? At the very least in the 3D viewer?
Thanks Andras, but I mean the scalar values of streamlines, not the values corresponding to any underlying volume or structural image. Maybe I did not get it right, but following the linked instructions, I did not find the described context menus, options. Also, being able to click on a point and knowing the value of the scalar value associated to the streamline vertex would be ideal. Hope the two videos in here illustrate it:
I think tracts are models, so you can use it Mable their color legend in Models module. In addition to that, you can display color legend for any color table in Colors module, but then you need to set the scalar range manually.
OK, thanks Andras. That (Models; ColorLegend) seems to work for the 3D.
However, it only works for lines and not tubes. Thus at times, if we are unaware that lines are being displayed, we will be showing a colorbar that does not correspond to what we think we are looking at. And at times, we prefer to get more insight using the tube visualization.
It should work for all the views where the model is displayed. If it does not seem to work in the latest Slicer Stable Release then try in the latest Slicer Preview Release, too.
You can display any number of data nodes and color legends, so it is possible that you can see unrelated data and color legend in the same view. By default, the node name is displayed in the color legend’s title, which should help in avoiding accidental mixups.
It seems that tubes does not use the default color mapping, probably because it has some additonal modes. It should be possible to update the code to play nice with the color bar (at least store the color table and color display range in the display node base class). Please create an issue for this in the SlicerDMRI extension’s issue tracker.
I meant that it in general. Tube display in SlicerDMRI extension is a special case - it had been implemented before color legend feature was added to Slicer core and unfortunately they are not compatible. Until the issue that you created (thank you!) is fixed, you can display a color legend by creating a dummy model node and selecting lookup table and setting the correct scalar range manually.