Hi there,
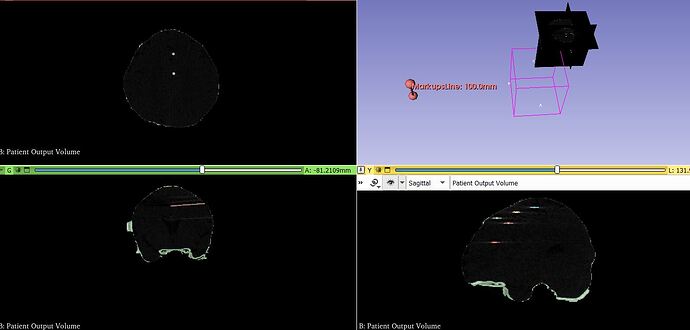
I am attempting to localise the end of intracranial electrodes within a CT scan. I have isolated an electrode in a binarised label map and am now trying to run SVD analysis.
I have been running this code;
import numpy as np
import slicer
from slicer.ScriptedLoadableModule import *

# Load the binarized label map node (replace with your actual node name)
label_map_node = slicer.util.getNode("Segmentation_1-label")

# Convert the label map to a numpy array
label_map_array = slicer.util.arrayFromVolume(label_map_node)

# Get the indices where the electrode is labeled (assuming electrode label value is 1)
electrode_indices = np.where(label_map_array == 2)

# Convert indices to points
electrode_points = np.column_stack(electrode_indices)

# Calculate the centroid of the points
centroid = np.mean(electrode_points, axis=0)


# Perform Singular Value Decomposition (SVD) on the covariance matrix
covariance_matrix = np.cov(electrode_points, rowvar=False)
u, s, vh = np.linalg.svd(covariance_matrix)

# Line direction is the first singular vector
line_direction = vh[0]

# Generate endpoints of the line
line_length = 100  # Adjust this as needed
endpoint1 = centroid - line_direction * line_length / 2
endpoint2 = centroid + line_direction * line_length / 2

# Visualize the data and the line in 3D Slicer
view = slicer.app.layoutManager().threeDWidget(0).threeDView()
line_source = slicer.mrmlScene.AddNewNodeByClass("vtkMRMLMarkupsLineNode")
line_source.SetPositionWorldCoordinates1(endpoint1)
line_source.SetPositionWorldCoordinates2(endpoint2)
The markup to show the location of the electrodes is present but in coordinated unrelating to the images.
Please could you give me some advise on how to resolve this.
Thanks
