How to extract both x-, y-, z-coordinates and normalvector at each point of centerline of airwaysegmentation

Hi. I want to extract a centerline of an airwaysegmentation. I have tried out different tools for this, among other SlicerVMTK extension, but always ending up in a situation with only the possibility of exporting x-, y-, z-coordinates but without corresponding normalvectors that indicate the actual curvature at each point.

It is possible to export the centerline with both the points and the corresponding normalvector at each point?

Tangent, normal, and binormal vectors can be easily computed from curve points anywhere, anytime, using a coordinate system generator class, such as vtkParallelTransportFrame, so we don’t need to save these vectors.

You can conveniently access these vectors in the world coordinate system in Slicer’s Python console as numpy arrays:

curveNode = getNode("OC")
curveNode.GetMeasurement("curvature mean").SetEnabled(True)
positions = slicer.util.arrayFromMarkupsCurvePoints(curveNode, True)
normals = slicer.util.arrayFromMarkupsCurveData(curveNode, "Normals", True)
curvatures = slicer.util.arrayFromMarkupsCurveData(curveNode, "Curvature", True)

If you prefer, you can access all these arrays as VTK polydata (to easily use in VTK filters or write to file):

curveNode.GetCurveCoordinateSystemGeneratorWorld().Update()
curvePolyData = curveNode.GetCurveCoordinateSystemGeneratorWorld().GetOutput()

Ahh thanks, that helped a lot, seems like the whole medical imaging industry can always rely on you lassoan :slight_smile:

2 Likes

I got the normals exported and was just about using it for a program im developing, when i noticed that the normals is not exactly what i expected them to be. I want them to indicate the normal to the plane to each point facing towards the next point, instead they seem to indicate the normal from the side if that makes any sense. I have tried to extract the centerline in Simpleware SCANIP, where they indicate what i want them to, but i would rather use 3D slicer, since it is open-source! :smile: Here are some pictures (first 3d slicer, second scanip):

Do you think there is any way i can calculate and export them in way so they indicate what i want them to?

Okay figured out myself that extracting the tangents would achieve what i wanted. Now I have a new problem… :slight_smile:

When using the “Extract Centerline” module, i set the curve sampling distance to 0.1269mm (Image 1), this gives 517 controlpoints spread along the centerline (Image 2). But when I want to save the positions and corresponding tangents (using the commands you showed me) to a csv file, I end up with way more points, 5375 points (Image 3).

I want to extract points with the specific distance 0.1269mm and then the corresponding tangents. Is there a way to access the tangents at each controlpoint instead?

So far I have made a way to calculate the tangents between each controlpoint, but do think there is a way this should be done more precise or is it as good as it gets?

Hi, Johan.

Your thread is also very interesting.

I might have the answer for the “many points (5375 points)”.

The Slicer program seems to interpolate the curve when calculating measurements such as tangents, normals, binormals, curvatures, etc. It seems to create nine points between each control point.

So, if the number of control points is N, the total number of measurement points is 10(N-1)+1 = 10N-9.

By the way, I am very interested in the visualization of normal vectors posted on April 12th. Actually, you needed the figure on the right, but I would like the one on the left.

Could you tell me how to draw normal vectors at each control point in 3D slicer with a Python script?

I appreciate any help you can provide.

Masa Shojima, Japan.

If your curve already have many points very close to each other then you can set the number of points per interpolating segment to 0.

This question was also posted and was answered here:

Thankyou for the respons!

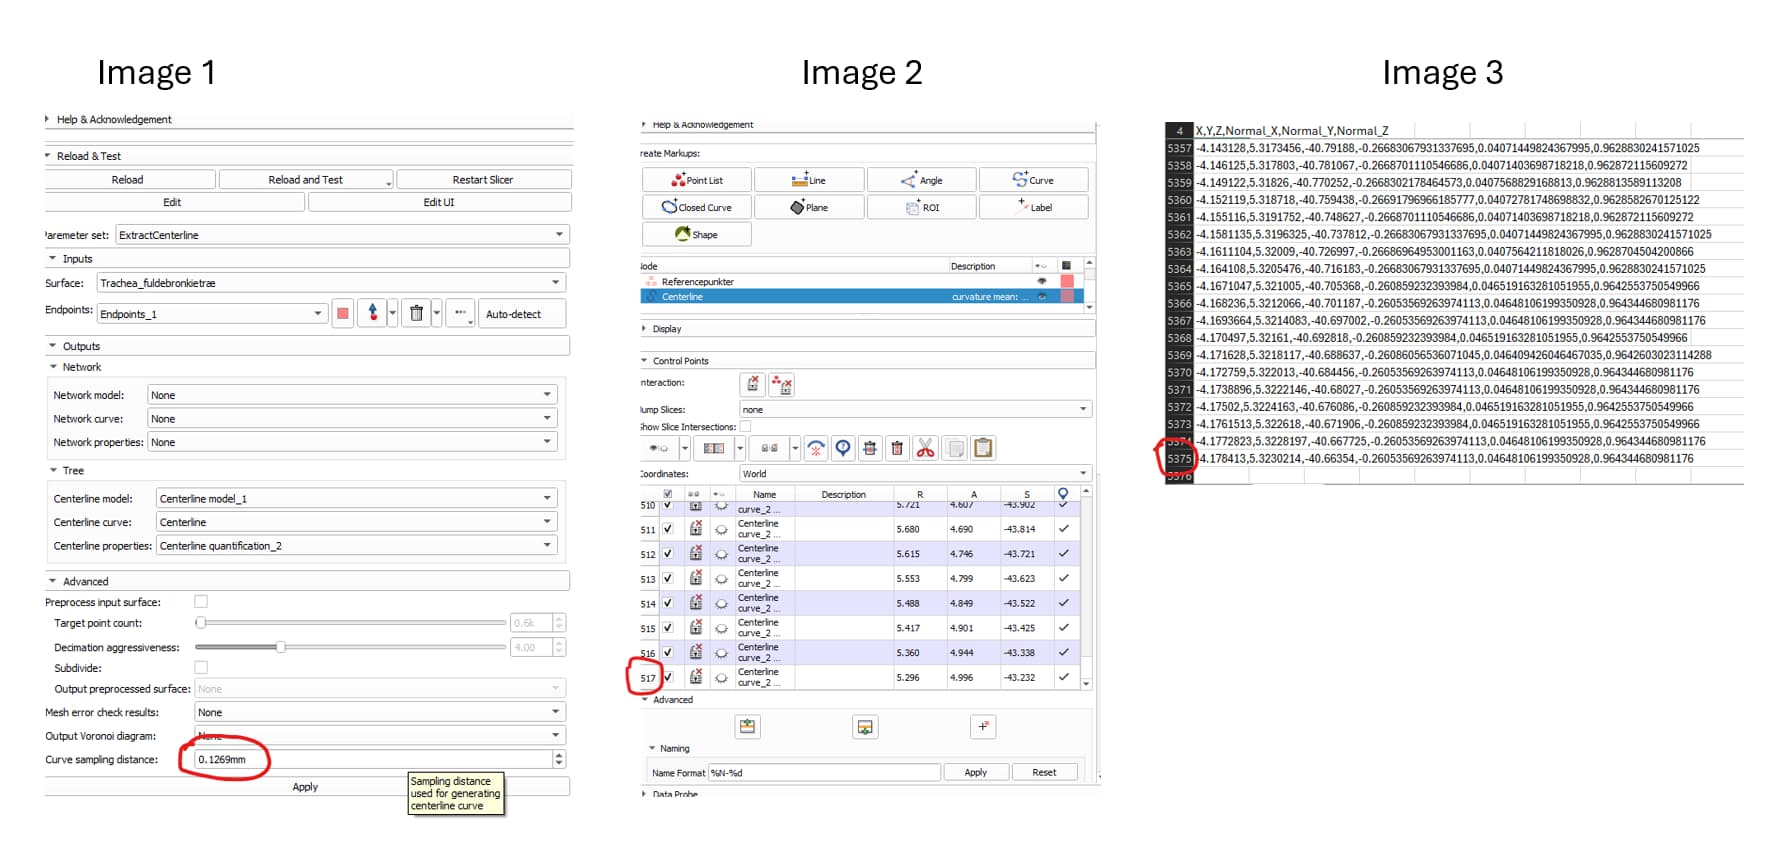
For the normalvectors I ended up using this script to just calculate the normals i needed from point to point manually. Ignore the variable referencepoints that is for something specific in my case. This creates a csv. file with the points and normals.

import slicer
import csv
import qt
import numpy as np

refpoints_name = qt.QInputDialog.getText(None, "String Input", "Enter name of referencepoints:")
centerline_name = qt.QInputDialog.getText(None, "String Input", "Enter name of centerline:")

curveNode = slicer.util.getNode(centerline_name)
curveNode.GetMeasurement("curvature mean").SetEnabled(True)
#normals = slicer.util.arrayFromMarkupsCurveData(curveNode, "Tangents", True)
#positions = slicer.util.arrayFromMarkupsCurvePoints(curveNode, True)

positions = slicer.util.arrayFromMarkupsControlPoints(curveNode)
normals = []
for i in range(len(positions)-1):
    normal = positions[i+1] - positions[i]
    normal = normal / np.linalg.norm(normal)
    normals.append(normal)

ref_points = slicer.util.getNode(refpoints_name)
ref_points_only = slicer.util.arrayFromMarkupsControlPoints(ref_points)

directory_dialog = qt.QFileDialog()
directory_dialog.setFileMode(qt.QFileDialog.Directory)
directory_dialog.setWindowTitle("Select folder to save the csv file")

directory_dialog.exec_()
selected_directory = directory_dialog.selectedFiles()[0]
print("Selected directory:", selected_directory)

file_name = qt.QInputDialog.getText(None, "File Name Input", "Enter a file name:")
file_path = selected_directory + "/" + file_name + ".csv"
print("Selected file path:", file_path)

with open(file_path, mode='w', newline='') as file:
    writer = csv.writer(file)
    writer.writerow(['X', 'Y', 'Z'])

    for pos in ref_points_only:
        writer.writerow([pos[0], pos[1], pos[2]])
    
    writer.writerow(['X', 'Y', 'Z', 'Normal_X', 'Normal_Y', 'Normal_Z'])
    for i in range(len(positions)-1):
        writer.writerow([positions[i][0], positions[i][1], positions[i][2], normals[i][0], normals[i][1], normals[i][2]])

print("Data saved to:", file_path)

For the plotting i was using matplotlib, but have also good succes with open3d, but it is not applicable with newer versions of python.

 import matplotlib.pyplot as plt

        # Create a 3D figure
        fig = plt.figure()
        ax = fig.add_subplot(111, projection='3d')

        # Plot the centerline points
        ax.scatter(centerline_points[:, 0], centerline_points[:, 1], centerline_points[:, 2])
        # Plot the normal vectors
        ax.quiver(centerline_points[:, 0], centerline_points[:, 1], centerline_points[:, 2],
                  centerline_points[:, 3], centerline_points[:, 4], centerline_points[:, 5],
                  length=0.1, normalize=True, color='r')

        ax.set_box_aspect([np.ptp(centerline_points[:, 0]), np.ptp(centerline_points[:, 1]), np.ptp(centerline_points[:, 2])])

        # Set labels for the axes
        ax.set_xlabel('X')
        ax.set_ylabel('Y')
        ax.set_zlabel('Z')

        # Show the plot
        plt.show()
1 Like

How kind you are!
Thanks a lot.

You can get really good, interactive plots right in Slicer’s 3D viewer, by simple Python scripting. For example, you can plot the tangent, normal, and binormal for each curve control point with a short Python script:

image

1 Like