I am trying to visualize a set of white matter tract masks in 3D using 3D Slicer. My current workflow involves loading the masks as segmentations and then using the “Export visible segments to models” tool to convert them into surface models. However, the resulting models are not ideal. As shown in the attached figure (using one tract mask as an example), the edges appear overly sharp, the surfaces contain holes, and there are isolated fragments where the structure should be continuous and whole.
Could you please advise on how to improve the visualization quality? For instance, are there recommended ways to preprocess the masks to generate better surface models, or is it possible to directly modify the surface models after generation?
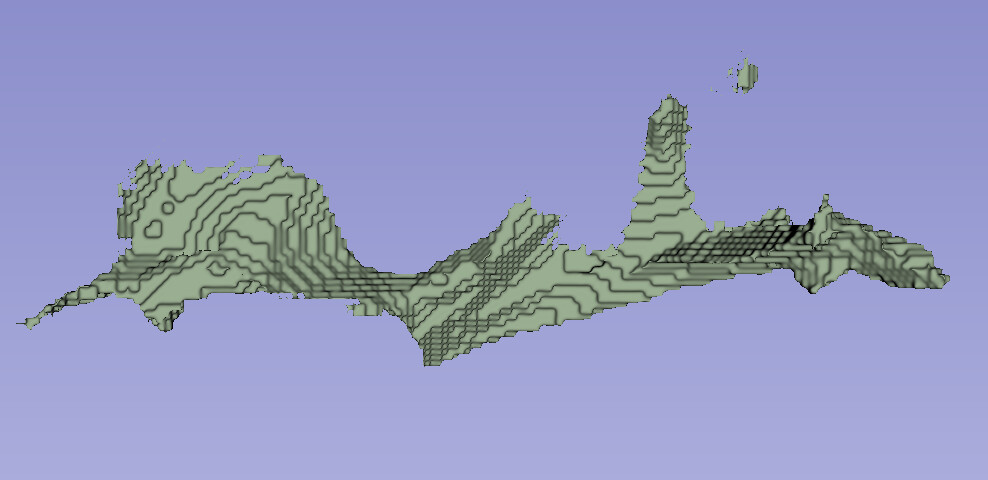
Thank you for the suggestion. Following your advice, I supersampled the ROI mask from its original 1mm resolution to 0.5mm and 0.25mm.
As shown in the attached figures, the surface model generated from the 0.5mm mask shows noticeable improvement in smoothness and continuity. I also verified that the isolated components observed earlier were indeed present in the original mask itself, and not an artifact introduced by the surface generation process.
At this point, the 0.5mm result seems to be the best achievable through resampling. Could you please suggest if there are any further steps I could take to enhance the visualization quality?
Thank you for your guidance on improving surface model quality. I have a related follow-up question regarding visualization. If it is more appropriate to open a new thread for this topic, please let me know.
I have calculated a specific brain measure (e.g., FA, MD) for each white matter tract mask and performed statistical group analysis. As a result, each tract now has an associated statistical value (e.g., T-value or p-value). I would like to visualize these statistical values directly on the corresponding 3D tract surface models using a continuous colormap, essentially creating a statistical overlay on the anatomy. My initial thought is to export the tract surface as a .vtk file and then embed the statistical data into the file, which could then be mapped to colors in 3D Slicer.
Is this the recommended approach for such visualization in 3D Slicer? If so, what tools or modules within (or outside) Slicer could I use to efficiently insert the statistical data into the surface mesh?
Yes, you can add a scalar field to the cells or points of the tracts and then select it for display in the models module. Depending on how you are calculating the statistical values, you may find it easiest to do this in python.