For further exploration, I needed to have interaction with the plot. For that, I used click and drag feature and managed to extract the data from the plot.
The problem is, since my plot is constantly updating, I cannot draw a rectangle on the plot. Is there any way to draw a rectangle that can stay over the top of the plot?
Thank you.
After doing some research, I found a work around but could not yet implement it. What I really want to do is to draw a rectangle over a constantly updating plot view.
I think Qt.Qpainter/ paintEven is the best solution.
however, I dont know how to implement Qpaint over a plot widget. Can you help me with this? Can you guide me how to modify paintEvent of Plot Widget?
Or is there an alternate solution?
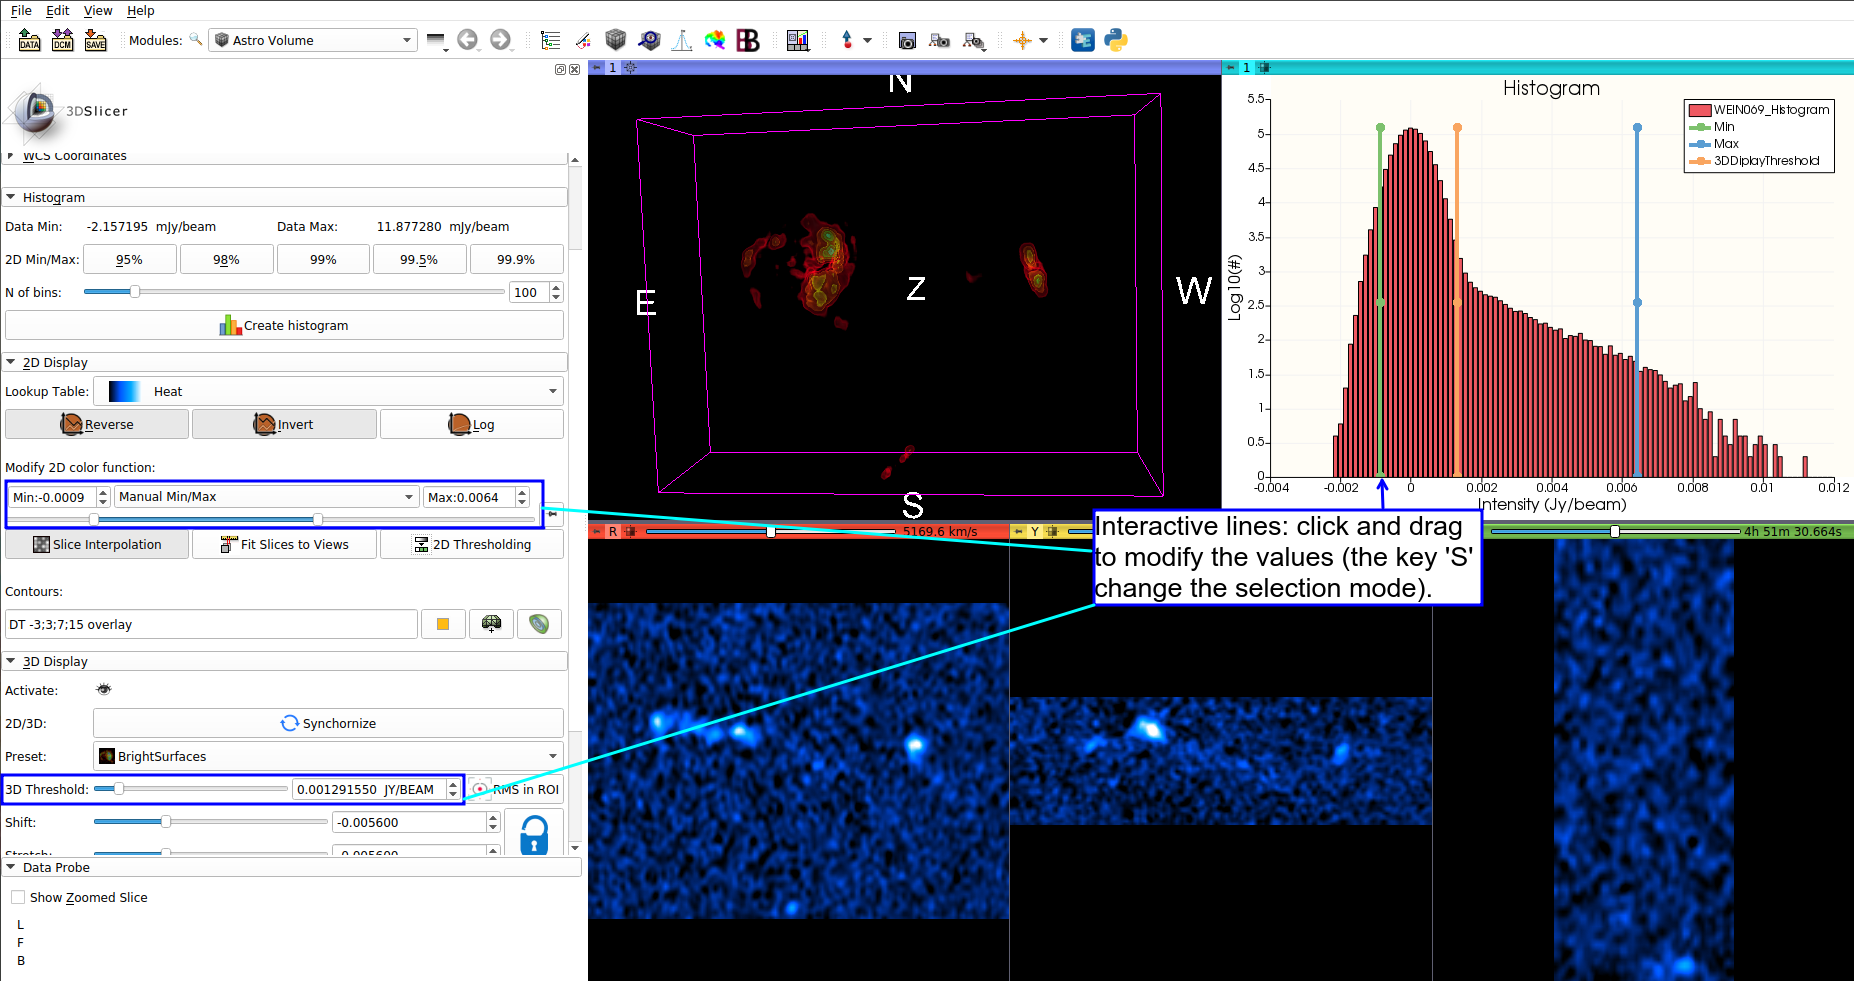
I want something like this: (orange and blue boxes, which can be drawn by a mouse, over a histogram)
I was wondering if we can have a some functionality in VTK plots? I tried to look into it but could not find the solution. @lassoan any tips maybe? Thank you
the selection (and interaction in general) are handled at vtk level:
for the selection the class uses some private methods, therefore I advise you to implement the functionality directly in vtk (for example: you could could instantiate an array of selection polygons and use them when interacting with CTRL + left click. In addition you can add an observer to check when the plots are changed and update the selection/fire a signal). Otherwise you would have to expose some of the methods as public or rewrite/copy everything in your code which I don’t advise.
the Slicer plot view widget already set up all the vtk infrastructure (the plot Qt widget uses the vtkchartXY, and the vtkchartXY handles all the vtkplot objects).
You will need only to modify the mouse interaction methods in the vtkchartXY. However, this is not straightforward, and you will need to modify in C++ the class vtkchartXY (then submit a pull request at vtk level and then update the vtk branch used by Slicer). I advise you to go for this path only if you feel comfortable with C++ and have a little bit of knowlege of vtk in C++.
I imagine that alternative solutions are:
you create the selection rectangle in Qt (as you suggested) and try to map the Qt view coordinates with the vtk view ones, then simply it will be to get the indexes from the plot objects.
you create in your module GUI some sliders or range buttons which indicates the user selection for the histogram.
I understand the problem and I have been trying to find the workaround. I have few queries regarding the alternate solution you provided. Can you please guide me on how to draw a selection rectangle on the top of the plot widget?
And How can I set up a Qt mouse interaction event with the plot widget? So far I am using vtk signal to extract the points from the plot.
As mentioned above, I am transmitting the VTK signal and added a listener function in python. Is there any way to make similar functions in python which respond to the mouse click and mouse release event over a plot widget. I am sure it is possible. Just a bit guidance on this regard would be helpful.
rethinking about this… I think it is a bad idea. In this way (drawing a rectangle in Qt over the vtk view) the selection will not take into account any resize/move event of the main windows, etc…
Therefore you will need to add properly actors in the vtk view and then perfom the selection. I don’t see an easy solution for doing this in python outside the vtkChartXY class. In general, the implementation will require dirty code/assumptions and to copy/reuse a lot of code and functionality already present in the vtk plot infrastructure.
If you would like such feature I advise to contribute to vtk by properly implement the feature in the C++ vtk infrastructure. Otherwise, you can go for a different/simpler approach, for example:
sliders in the module gui for making the selection
Perfect @lassoan and @Davide_Punzo. Line plot is a good option. I am also looking more into modifying vtkchartxv class.
The suggestion by Lassoan pretty much gives me the desired output. I am gonna move forward with adding the histogram as explained in Segment Editor. Let’s see if I can make any further improvements on it.

