May be I am wrong but it seems LungCTAnalyzer cannot be used to quantify lung fibrosis. Perhaps this feature will be added to the extension in the future. Fibrosis quantification will be very useful for many. I have read about some software for this purpose but either they are old or unavailable or not deployable on todays computers, like LUFIT and YACTA, or commercial and pricey, like IMBIO.
What do you want to see, which patterns are of special interest for you , what would you want to quantify in ml. Please make an anonymized dataset available so we could have a look at it in Slicer. You could also post some screenshots here where you think LCTA fails.
Dr. Bumm, thanks for responding. I am a novice and actually don’t know myself but was wondering if some expert had assessed LungCTAnalyzer for the purpose of quantifying fibrosis in ILD, IPF, etc. by measuring GGO, honeycombing, reticular density, etc. (CT pattern or texture analysis). E.g., is ‘infiltration’ identified by LungCTAnalyzer a good measure of GGO?
Below, I have copied some text about the method used by the CALIPER CT pattern analysis software that purports to quantify fibrosis.
Following anatomic segmentation, the parenchymal detection and classification is performed by using a similarity metric to match parenchymal histogram features within 15x15x15 pixel volumes of interest to validated histogram signatures of characteristic voxels and morphological assessment of classified voxels in order to label each pixel in the dataset with the radiographic characteristics. These labels specify a pixel as belonging to normal lung parenchyma or to features of ILD such as ground glass opacity, reticular densities, honeycombing, or low attenuation areas (with sub-classes of mild, moderate and severe). The technique involves a sliding window supervised classification scheme described by Maldonado et al. [7] The total volume, measured in liters, and the percentage of normal parenchyma, low attenuation areas (mild, moderate, and severe sub-classes), and interstitial abnormalities (GGO, RD, and HC) were automatically generated by the CALIPER software. The total volume was comprised of low attenuation areas (mild, moderate, severe), ground glass opacities, honeycombing, reticular densities, normal areas, and vessel volumes. Total interstitial abnormalities were defined as the summation of GGO, RD, and HC. The remainder of the lung volume (vessel volume, normal and low attenuation areas) was summed as non-involved lung areas.
I have no experience with CALIPER, nor have I analyzed ILD patients yet.
Pattern recognition is something you can not do with Lung CT Segmenter, which was made to determine thresholded areas of special lung density. i.e. pre-setting a threshold value of Hounsfield Units and obtaining a segmentation of both lungs and a quantitative evaluation of emphysema, healthy residual lung parenchyma, GGO, and consolidation (like in this paper)
Here is a Lung CT Analyzer result in a patient with lung fibrosis and a good visual correlation of the fibrotic lung changes and their detected volumes. I do not see why you could not use LCTA this way in IPF - if you need more threshold ranges please let us know.
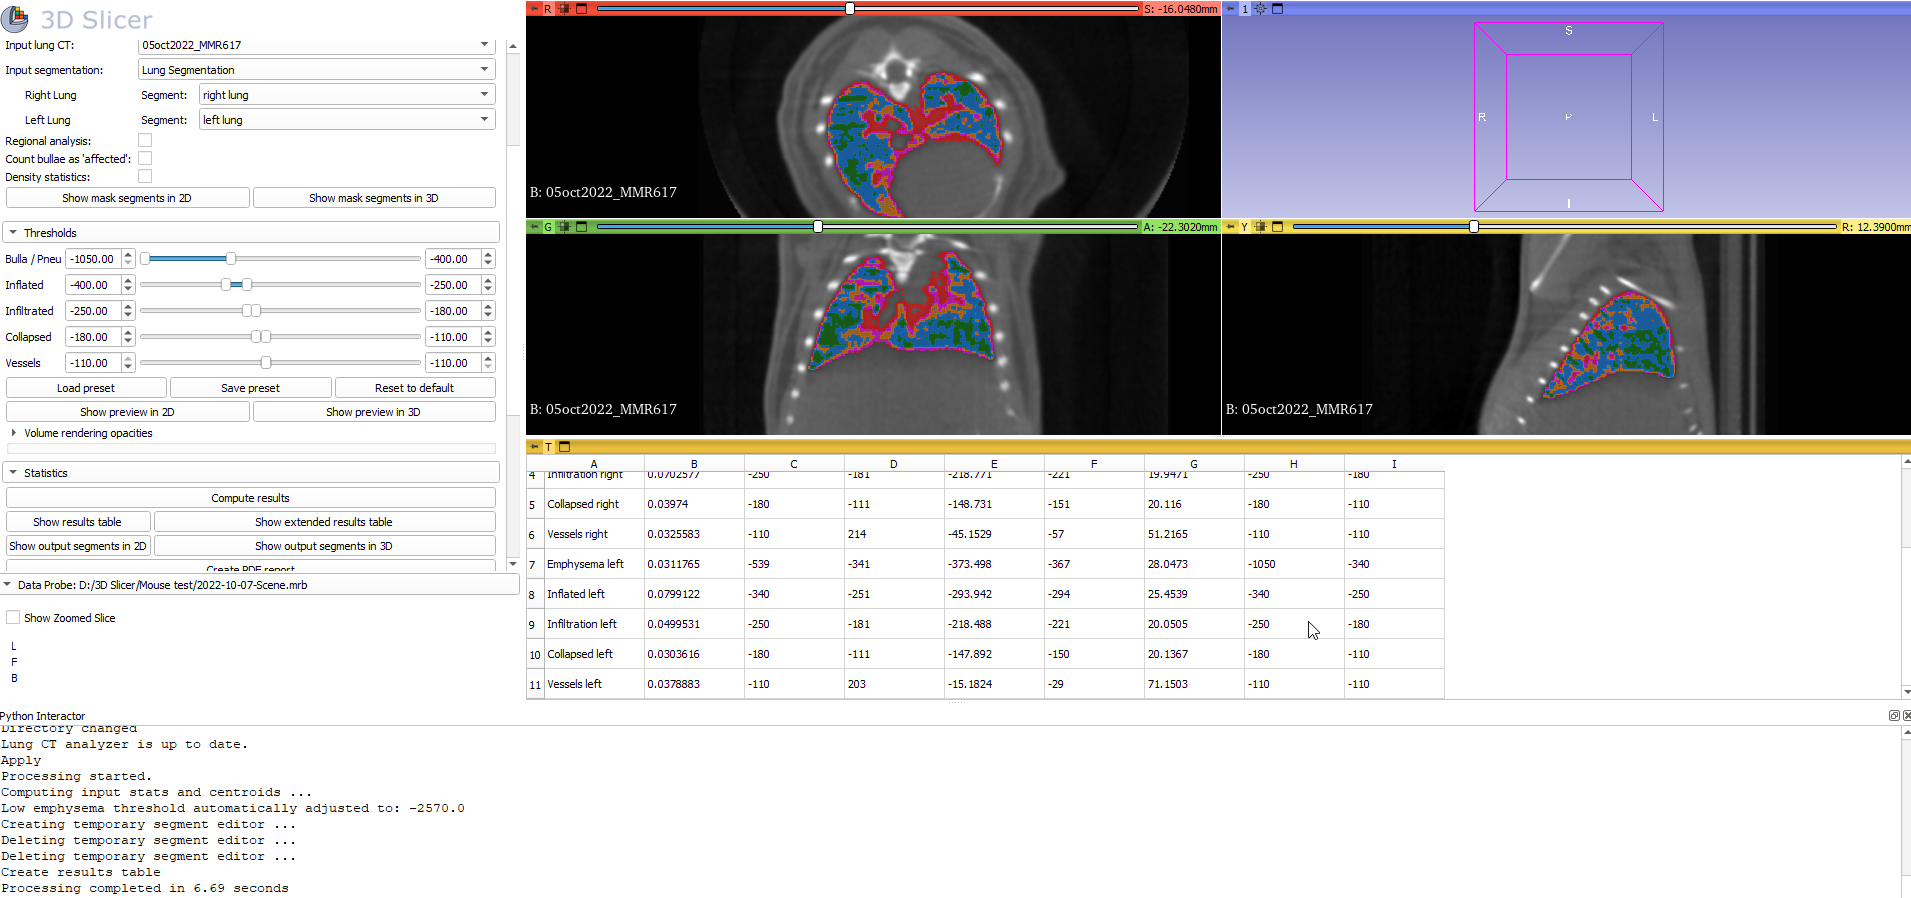
Hi, i´m using “Lung CT Analyzer” on mices with fibrosis. First, i do a manual segmentation; treshold+paint+grow form seed+smoothing, and once i got the segmented lungs, when i try to run the CT Analyzer, at 85% of running it, appears the following error: Failed to compute results: expects 0 <= id && id < GetNumberOfValues().
What could i do?
Hi, which version of 3D Slicer and Lung CT Analyzer do you use?
Could you post a screenshot of your 3D Slicer screen before you press the “Compute results” button?

Would it be possible to provide a link to one of your datasets (preferably a mrb bundle)? Would be helpful to provide a fast solution or to identify a bug.
Only if the mouse agrees and we do not get into anonymization problems here ![]()
jajaj yes, there you got the nrrd
![]() 05oct2022_MMR617.nrrd
05oct2022_MMR617.nrrd![]()
also, i’m sending you the dicom
![]() 2022-10-05_12-56-03.zip
2022-10-05_12-56-03.zip![]()
i’ve already created a folder
The problems arise because Lung CT Analyzer has been developed for human CT data and the mouse data has different dimensions and thresholds. I removed some bugs in LCTA and got this running, but we will see how meaningful the analysis will turn out. Please expect an update on the extension within the next few days (to version 2.56) which will no longer have the error messages.
Mouse test:
wow, thank you, that’s amazing, so grateful ![]()
I’ll be checking for the update.
Hi,
sorry to disturb you again, but I was wondering how you do the segmentation, so I can see the threshold values you used and that stuff.
Thank you,

that’s useful, but I wanted to know how you do to get the lung segmentation from the image, if you use tresholds and grow from seeds, a segmentation extension…


Hi,
The segments “PA”, “PV” and “tumor” are empty by default and only provided for the convenience of users who need to segment these structures manually.
“vesselmask” gets segmented as soon as you select
![]()
It is in the plan to populate all of those segments (especially tumor) with AI or 3D Slicer segmentation techniques.