Hello,
We need to plot a series of line segments in 2D. The number of line segments is variable and can be large, so using a node to represent each line segment is not practical. This is not currently supported in Slicer or VTK plots. There are standard functions available in R and MATLAB to create line segment plots from pairs of endpoints that could be used as a model for this function.
We’ve started a lab page for this topic and have included an example using the R function segments. We’d appreciate feedback and ideas.
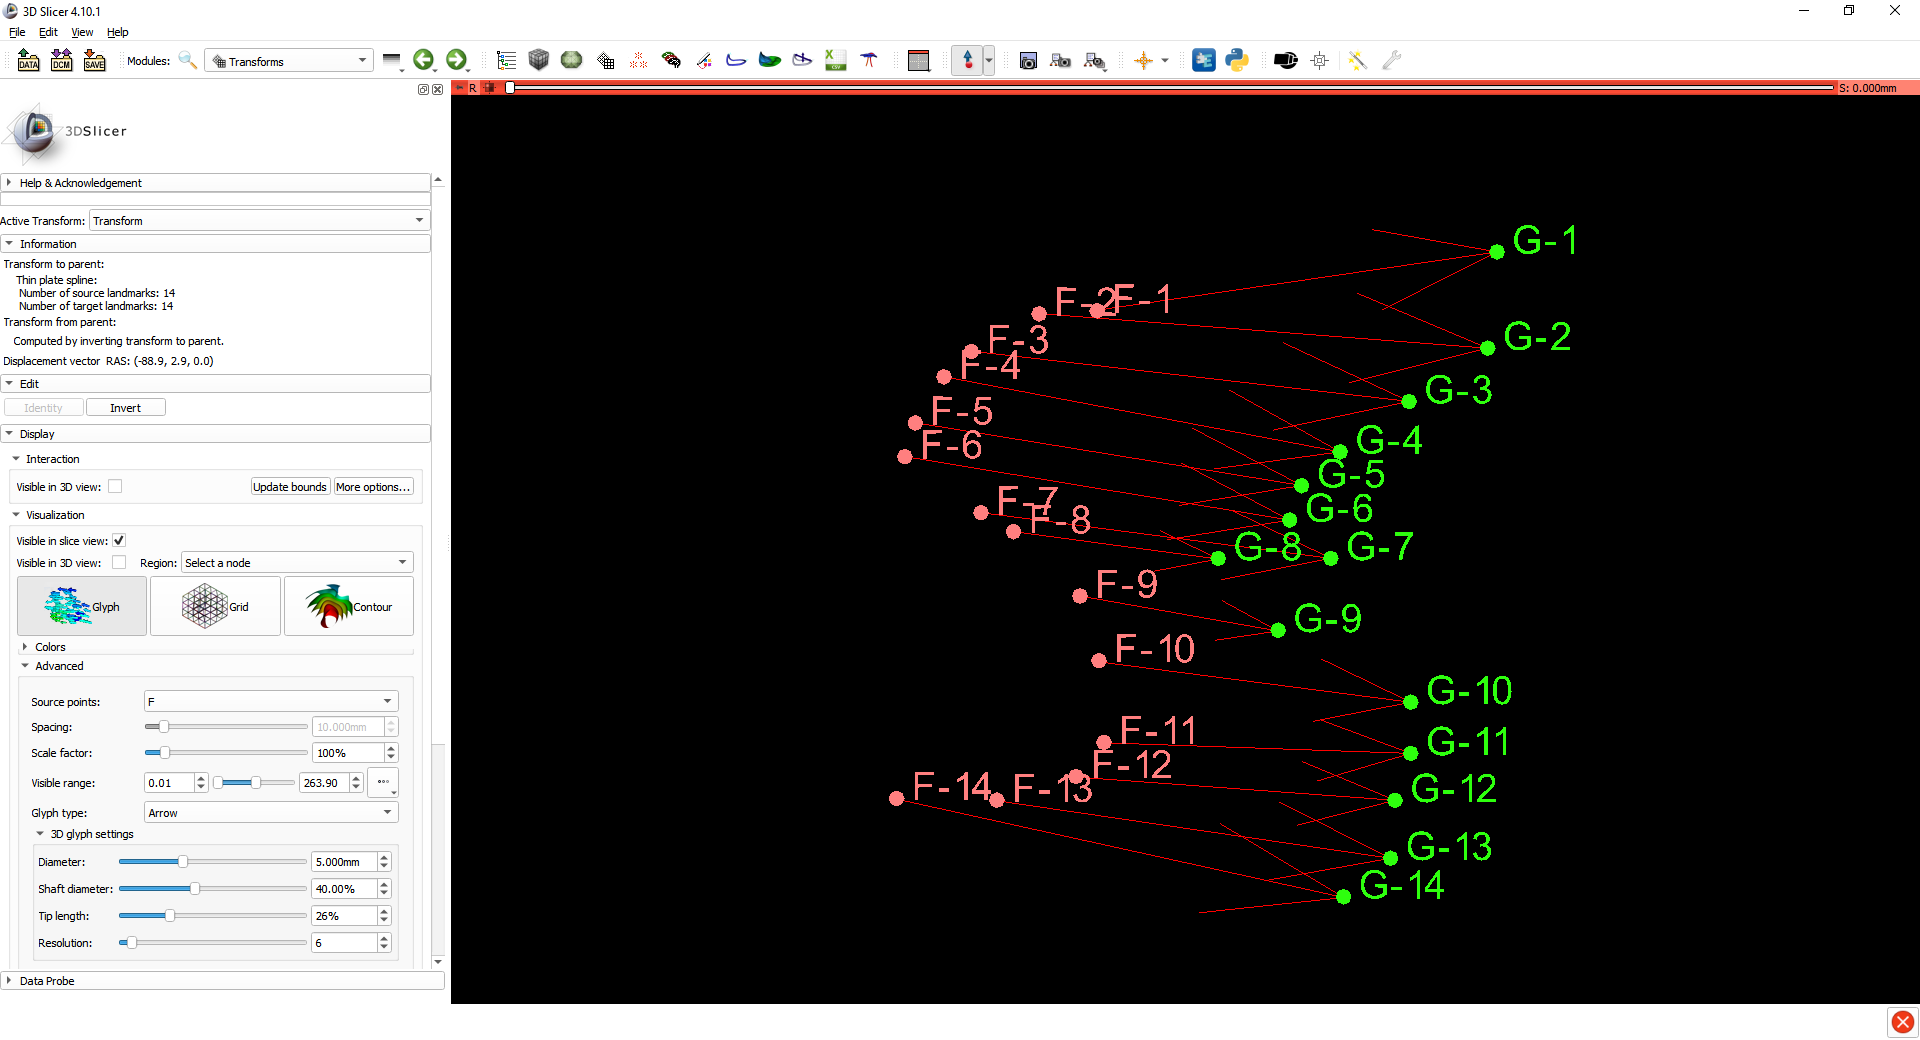
We already have such plots! It may be not obvious, but 3D view is actually a very sophisticated 3D plot. We can plot displacements defined by transforms. You can choose to show displacement only at markup positions:
We just need a bit fancier axis actors. The current axis actor is always just a centered horizontal line, but there are several 2D and 3D box axes to choose from in VTK.
Hi Andras,
Yes, we do use the 3D. But for various reasons, we need to be able to their 2D plane projections using the Plot infrastructure. That’s where got stuck.
Thanks @lassoan, this approach should work for us!
I have one more question on setting up the view. I need to get the 3D vectors projected onto a single plane, which it looks like you’ve done in the red slice view. My slice view looks like a cross section. Can you tell me if there is an option to set this? I recall seeing a projection setting in the models module, but don’t see something similar in the transform module.
If you use a thin-plate spline transform then you should see the arrows connecting each pair of corresponding fiducials.
Note Fiducial registration wizard determines “Transform from parent” transform from the landmarks and “Transform to parent” transform is computed on-the-fly. If the displacement field is irregular then the inverse may not be accurate and you may get something like the image above. To make sure the arrows show the exact displacements defined by the fiducial point pairs, go to Transforms module, flip To/From fiducial list and click “Invert” after computing the transformation in Fiducial registration wizard (then “Transform to parent” displacement is visualized, which does not require inversion).