If my understanding is right, in the network model, a segment is the vessel that lies between two junctions or a junction and a free end. So I am not sure why the curves have to be split. Could you please explain why curves have to be split and the downside of not splitting?
The fact is that in network extraction result, curve segments are not split at branching points. If it is a problem for you (I would guess it is), then you need to split them. VMTK has lots of great tools, so maybe the solution is to simply apply a processing filter.
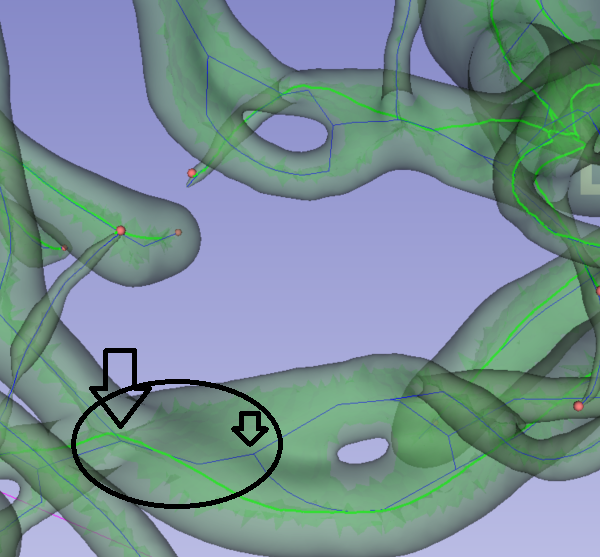
I mean what I wrote in the picture above "… curve would need to be split here.
Difference between network and branch extraction is a different story. Network can have loops, while I think branch extraction always produces a tree.
From VMTK documentation, tutorials, source code, and mailing list.
Thanks, I think now I understand what you are pointing to. I got a little confused, sorry.
Could you please explain a bit on how the coloring has been done?
You can choose which point/cell data array to use for coloring in Models module Scalars section.
Thanks @lassoan
In summary, from what I understand, I think the size of celldata array is not equal to the number of segments (a segment is the vessel that lies between two junctions or a junction and a free end) in the network. And this is the question that I have raised in vmtk mailing list.
For small model, I could visually check for the number of segments and size of cell array. Both were equal.
I could check the celldata array’s size for the large model but I am not sure how to get the number of segments.
I’ve checked and tou are right, cells are indeed segments between branching points. So, I can add a quantification result table for them very easily.
I’ve implemented curve node export and properties computation for extracted networks. It’ll be available in tomorrow’s Slicer Preview Release.
Glad to know that . I hope the coloring would also work fine now using cell data.
Thanks a lot for your wonderful support.
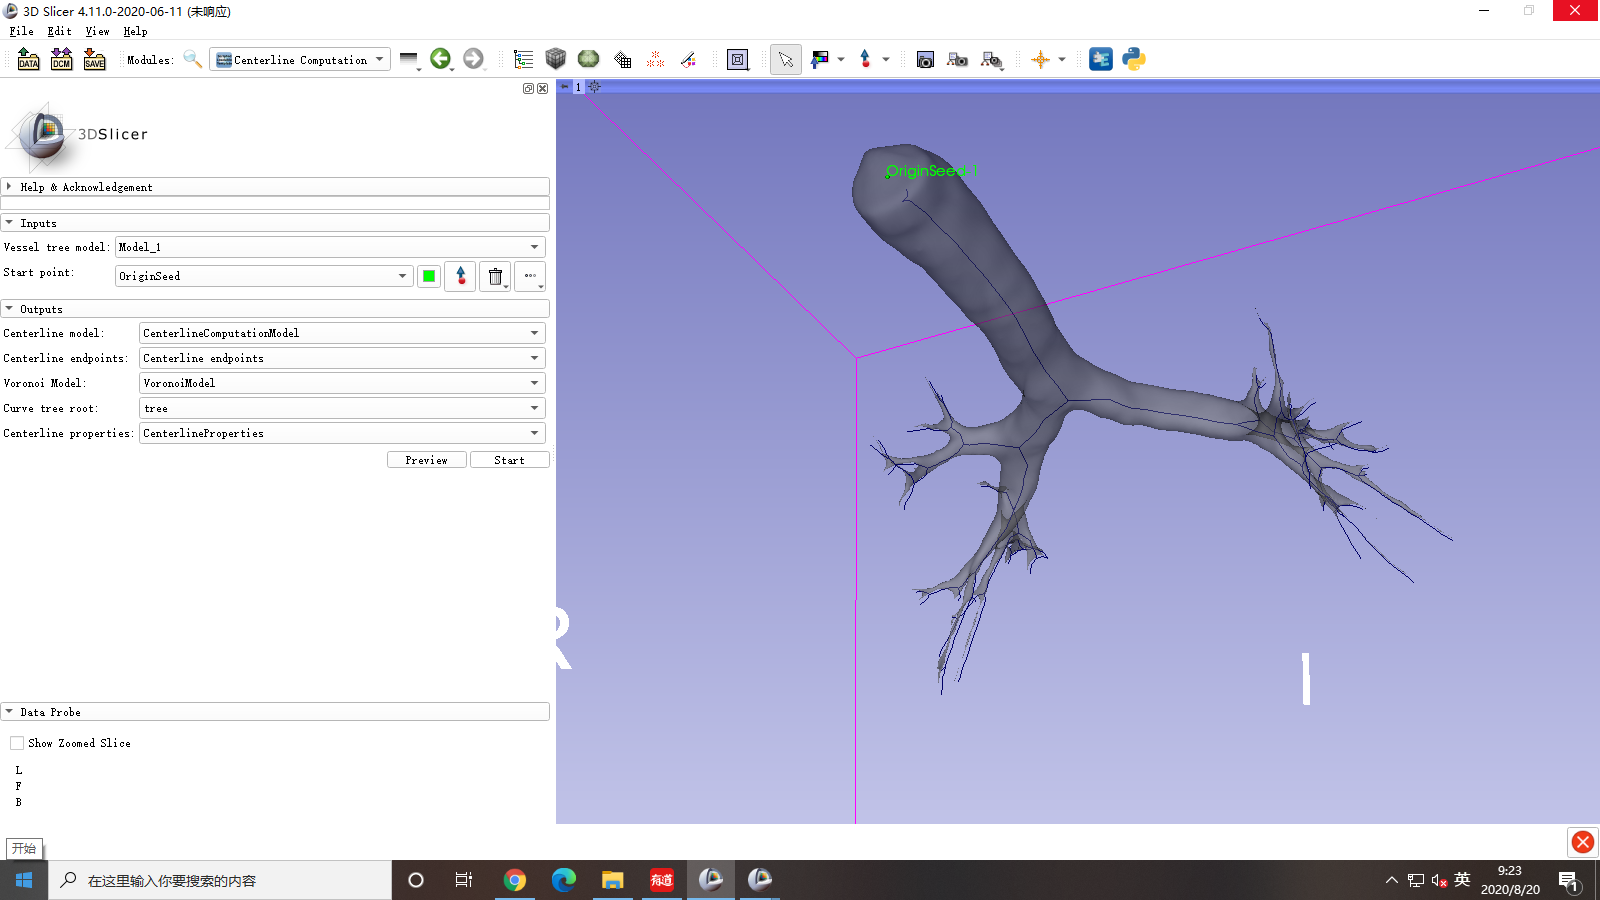
I utilized module “VMTK” to compute the centerline of lung airways, which need a long time to run.In addition,the result is not good.The airway tree is out of order and the centerlines line incorrectly.
And I installed other versions,like 4.11.0(2020-06-24) which doesn’t have the function “Centerline Compute”, 4.11.0(2020-05-14) which doesn’t have the option “Curve tree root” and can’t create the airway tree,those versions all can’t draw the tree.
In recent Slicer-4.11 version we hugely improved the module and renamed to “Extract centerline” to make it more consistent with module naming conventions. It has built-in automatic decimation to make centerline extraction 10x-100x faster without impacting accuracy, can work directly with segmentation input, export curves, compute statistics, etc.
I just installed the version 4.11.0(2020-08-18),but it doesn’t have the module “centerline compute”, so how can I get the centerline?
In recent Slicer-4.11 version we hugely improved the module and renamed to “Extract centerline” to make it more consistent with module naming conventions.


From your screenshot is seems possible to me that you created an empty model node called Model_1 and did the processing on that. If so, then it’s no surprise that the output is empty. Choose “Airway Label” instead.
Use ‘Extract centerline’ to compute a centerline.
‘Centerline metrics’ is meant to plot the diameter distribution around an existing centerline.
