Thanks for the very valuable repository. I am wondering if it is possible to generate the tubular mesh based on a synthetically generated centerline with bifurcation?
So what I have is a graph/tree structure with nodes indicating each point along the centerlines with radius at each point, as well as edges indicating the connectivity of each point, but what I do not have is the Voronoi diagram.
Is it possible to reconstruct the surface/volume mesh from such centerlines using this tool?
Thank you so much for your reply. I am wondering if there is any example of using vmtkcenterlinemodeller, because I really cannot find one? Especially, what I have is a graph structure (V, E), where V could be a numpy array of |V| * 4 indicating xyz coordinates + radius at current location, and E could be a adjacant matrix in |V| * |V| where each value is 1 if the nodes are connected and 0 otherwise. How should I convert such a data structure to the Centerlines vtkPolyData and the radiusarray, which are the required input to vmtkcenterlinemodeller?
Assuming the graph is acyclic you shouldn’t have issues creating a centerline. The numpy interface (vmtknumpytocenterline) is probably easier to work with compared to directly using vtk objects. You’ll have to add the radius as a PointData array.
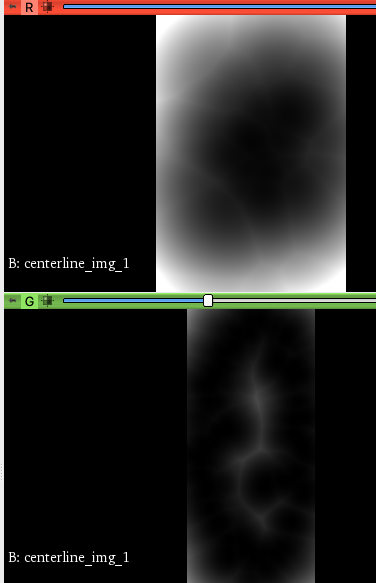
Thanks a lot for your reply and hope you are doing well! I know it’s been a while but I actually made it work by following the steps you provided! And the mesh it generated looks very good. But I am just confused about how to interpret the output from vmtkcenterlinemodeller before running the marching cube, and what should be an appropriate level value for vmtkmarchingcubes in this case.
Intuitively I would think that vmtkcenterlinemodeller generates high intensity values inside the tubes around the centerline and low values outside. But I checked it does have high intensity values around the tube, but it has higher values near the corners.
More confusingly is that, when I apply vmtkmarchingcubes afterwards, if I use a high value for level, I am getting thicker tubes and thus merged sometime. If I use a low level value, it will be thinner and sometimes disconnected. This is a bit contrary to what I would think, because usually I would think I(x)>level means inside, so that a small level means larger parts inside and thus thicker tube.
Can you maybe recommend a paper about the theories behind vmtkcenterlinemodeller so that I can better understand it?
By default it is negative inside, 0 at the boundary of the vessel and positive outside. So corners will probably end up with the largest value since they’re farthest away.
Appropriate level for marching cubes should be just 0, if they are disconnected you might need to increase the sampling resolution used in vmtkcenterline modeller, the default of -dimensions 64 64 64 might not be sufficient depending on how thin your vessels are
I don’t think there’s a paper discussing this, the tube function used is briefly discussed in " An image-based modeling framework for patient-specific computational hemodynamics". it looks like a distance transform so you can try looking that up.