I want to isolate parameters such as Tortuosity, Curvature, Torsion, Length, Radius etc. for the centerlines. The current vmtk version groups these centerlines based on Centerline Ids, Group Ids etc.
But it still calculates all the metrics for the centerlines based on CenterlineIds and not based on GroupIds as it should have for parent and daughter branches in the vasculature.
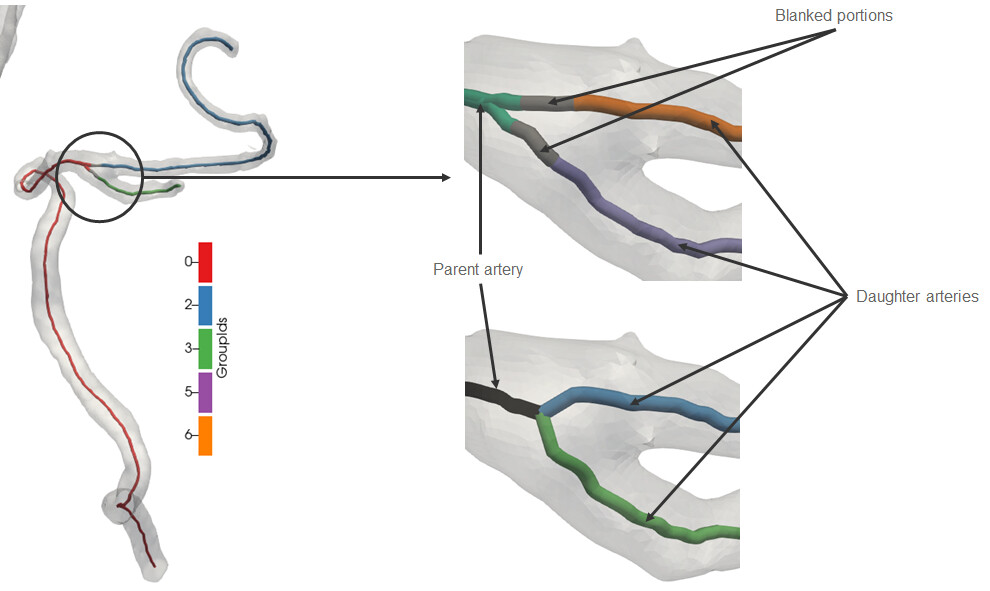
Should I use the Blanking arrays to separate the values along the centerline curves? In that case I would lose out on the centerline metrics for the blanked regions of the arteries.
The other option is to use the Centerline tree which contains the merged network of centerlines near the bifurcations. However this is just an approximation and is not the true representation of the centerlines.
Could you @lassoan suggest a better way to isolate centerline data without using the merged version?
I’m not that familiar with the VMTK metric computation classes. It may be easy to change them or add some more options about how to group centerlines. You can send a pull request if you have any specific suggestion.
While using VMTK filters for computing metrics can be convenient, it may be similarly easy to get all point and cell attributes as numpy arrays, filter them using numpy indexing and compute statistics on them using standard numpy functions.
Do you mean that vtkvmtkPolyDataNetworkExtraction result is more accurate than vtkvmtkPolyDataCenterlines? I find the centerline extraction result much more anatomically accurate than the network extraction result. For example, in network extraction result, small side branches perturb the centerline of the main branch, which does not happen in reality.
vtkvmtkPolyDataCenterlines is definitely more robust (3D Slicer implementation) than the current vmtk implementation of the centerlines and also represents the true centerline data as compared to the data obtained from the vtkvmtkPolyDataNetworkExtraction class.
I have used centerlines generated using the vtkvmtkPolyDataCenterlines class in 3D slicer in my code for post processing. But I wanted to categorize different centerline metrics according to different arteries. This is only possible using the vtkvmtkPolyDataNetworkExtraction class since it removes the blanked portions of the centerlines and is easier to use as a 1D graph. But in doing so we lost the information near the bifurcations. Hence I wanted to know if there would be any alternative way of separating information related to the centerline metrics using vtkvmtkPolyDataCenterlines rather than vtkvmtkPolyDataNetworkExtraction?
I have a few ideas in mind for this. I will send out some pull requests along with some previous other requests related to obtaining more metrics from the centerline data that I had raised earlier.
I’m not sure if that is exactly what you are after or not, but “Centerline properties” table that Extract centerline module creates contains radius, length, curvature, torsion, tortuosity values for each branch.
I would also add that in recent Slicer Preview Releases, curves can store any number of point data associated with control points of the curve. Currently, we only store radius value there, but we could add all other metrics as well. You can get these measurements as numpy arrays and compute statistics like this (get average and 15th percentil of the radius of branch Centerline curve (0)):
Yes, I am aware of this table which provides detailed quantification of different metrics. However it is based on the input obtained from the merged centerlines which does this to the original centerlines extracted using vtkvmtkPolyDataCenterlines.
I want to obtain these same metrics based on this:
To add to what I was previously addressing, on comparing different metrics for centerlines generated using the vtkvmtkCenterlineBranchGeometry() with 2 inputs one being the merged centerlines vtkvmtkMergeCenterlines() and the other being centerlines extracted using the vtkvmtkCenterlineBranchExtractor() class, we can see the sharp variations in Curvature since its computation involves first, second and third order derivatives.
Hence the choice of using a merged centerlines as an input as used in 3D slicer versus using the branched centerlines as an input does play an important role in obtaining correct metrics.
I haven’t noticed the difference between the bifurcations shape introduced by vtkvmtkMergeCenterlines but I see it now:
Slicer can search for a path in the non-merged centerline tree, which could be used instead of vtkvmtkMergeCenterlines:
Currently, we just get the point coordinates and not copy point data from the centerline model into curve node, but it would not be hard to implement this.
If you are interested in computing the curvature, it is one of the built-in measurements of curve nodes. I’ve tested this curvature measurement on the non-merged centerline curve and got very noisy results:
Most probably it is due to noisy centerline (points are not along a smooth curve, probably distance between points varies, too). If I fit a spline to the curve (by resampling the curve using 50 control points and then setting curve type to spline) then curvature measurement becomes correct:
Most likely in the noisy measurements you have the same issue, i.e., the centerline is not smoothed and resampled at equal distances.
About other metrics:
Radius values should have no issues, as they are not changing quickly and not sensitive to any resampling or smoothing.
Length computation is trivial.
Tortuosity is not a metric that makes sense for a few long line segments like you have in your images. I think it is a very poor metric overall, which I only see making any sense if computed for hundreds of short line segments in a dense tree with lots of branching.
Thanks for clarifying the curvature results! Could you tell me how you developed a tube representation of the centerline model to post process the curvature metric? Currently only radius is the scalar that is available to post process, following on my previous issue.
I used the earlier method you mentioned in the video to coincide the merged centerlines (curves/splines) on the vtkpolydata surface representation of the centerline model but got this.
Is there a way to obtain the curve/spline representation for the centerline model or the vtkpolydata?
Basically I want a bifurcation point in the centerline model so that I can separate the vessels for the hemodynamic analysis later on.
Thanks.
Could you elaborate a bit more one this? I aim to have a few hundred of coronary artery trees. Would it make sense to study tortuosity of each tree? Or tortuosity of each part of the coronary tree of each 3d model?