DeCAL: groupwise analysis

Dear all,

I would like to analyse two groups of skull-data, micro-CT data.

The idea is to start with group1

  • run DeCAL with the data of group1, use the models and fixed LMs to generate an atlas and the alignedLMs (group1)

Next, repeat the DeCAL with the data of group2, use the models and fixed LMs to generate an atlas and the alignedLMs (group2)

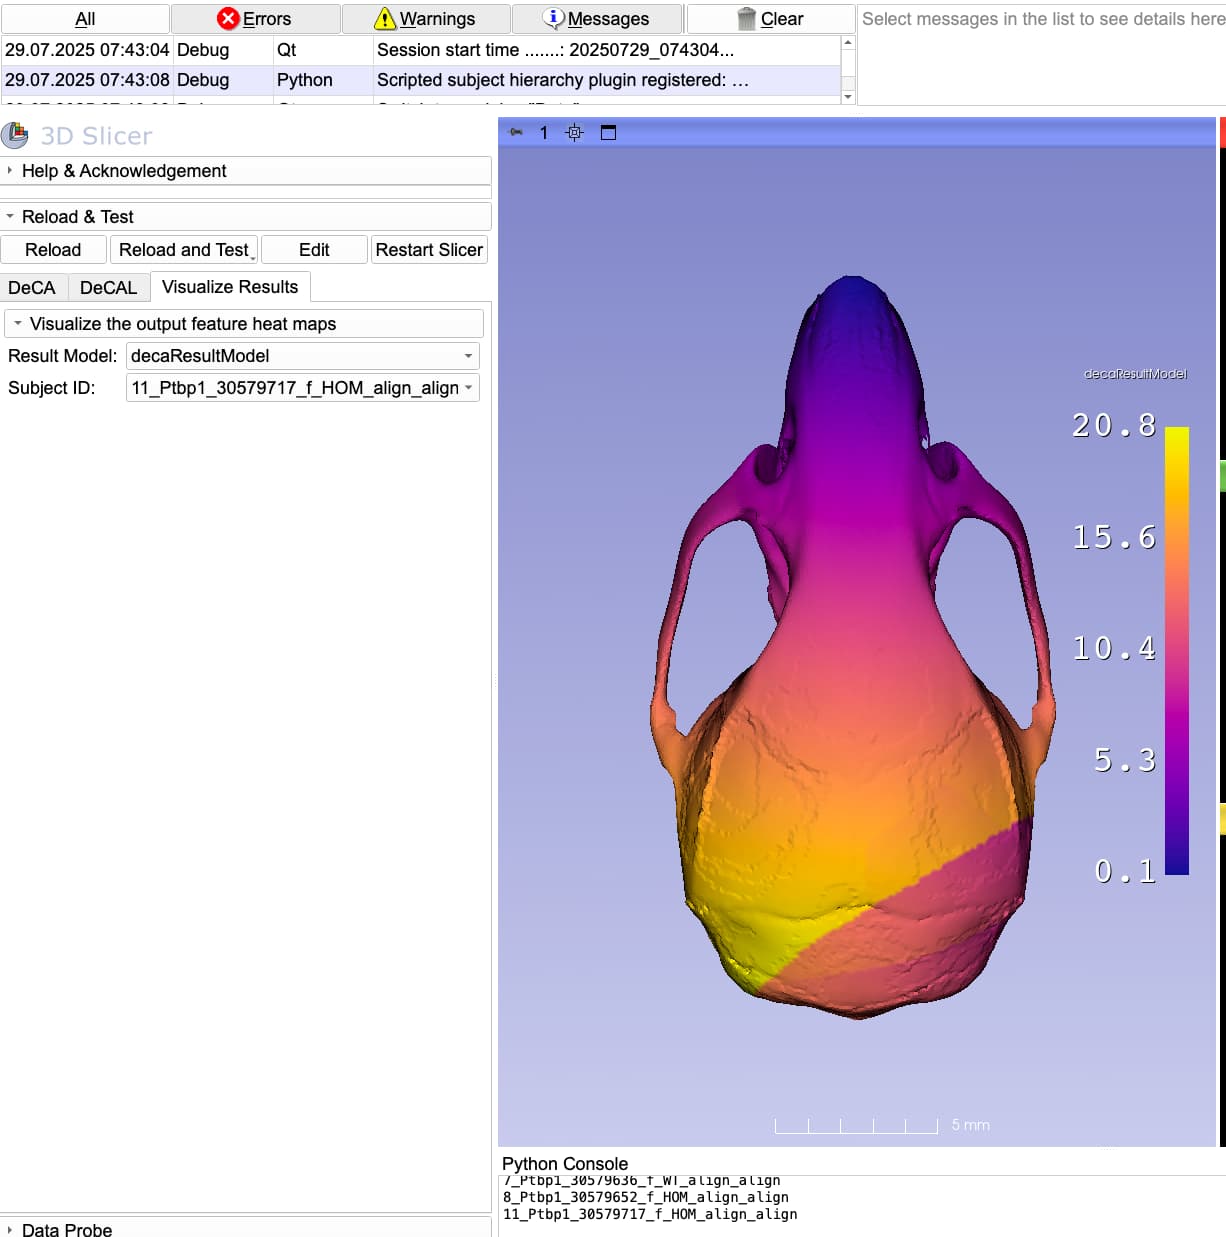
Now use DeCA to analyse group1 & group2

  • load atlas of group1
  • perform “Shape analysis”
  • model directory: folder of the alingedModels of group2
  • landmark directory: folder of the alingedLMs of group2

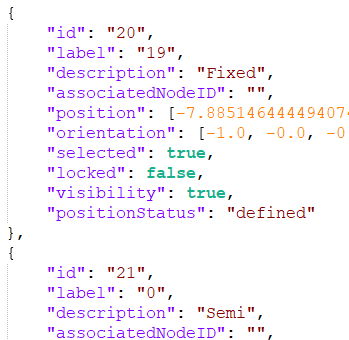
I guess, important would be to merge the “fixed” and the “SemiLMs” as descripted
in the tutorial.

The idea is to create an atlas based on group1. Next, to analyse “shape variances” between the atlas (group1) and each individual data set of group2. And, to analyse shape differences between the atlas1 and atlas2.

This approach is motivated by the fact that group1 varies in shape in comparison to group2, and therefor the atlas should be derived only from the data of group1.

Is such an analysis feasable with DeCA and DeCAL? And what are the important steps?

Thanks for your support.

Best,
Markus

This can be done in DeCAL and SLicerMorph up to a point. But there are couple important things to consider.

  1. Why are you building two atlases separately? This will create a headache for you, since during the dense semiLM creation there is no guarantee that it will create identical number of points for both groups, and if the point number and distribution is not identical, you cannot do a landmark-based shape analysis.
  2. Instead you should build the atlas using all your samples (including group 1 and 2) and then create the semiLMs etc, and then use statistical models to find groupwise differences.
  3. Statistical models are not yet available in SlicerMorph, but we do have a proposal to develop that. Until then you can migrate your data into R and then conduct the statistical analysis of group wise differences there.
1 Like

Dear Murat,

thanks a lot for your response and the detailed insights!

Headache,… hmmm… should be avoided :slight_smile:

Will stick to your advise!

Best,
Markus

Dear Murat,

could you please comment on the following steps. I tried to combined the DeCAL and the DeCA processing / analysis methods.

First DeCAL was used, on the mouse skull CT data; in addition 20 manually placed landmarks are considered.
DeCAL was used to generated:

  • atlas model of both groups
  • atlas landmarks (300 points in total) of both groups
  • aligned individual models
  • aligned individual landmarks (300 in total)

Next the idea is to use DECA and perform shape analysis on the aligned data derived by DeCAL

  • folder atlas model: DeCAL derived atlas model
  • folder atlas landmarks: DeCAL derived atlas landmarks (300 points)
  • model directory: DeCAL aligned individual models of mice skulls
  • landmark directory: DeCAL aligned indivual landmarks of mice skulls

Finally the analysis should start by hitting “DeCA”.

Unfortunately only the Output folders were created, without any content, and the atlas model together with the landmarks are shown in the 3D view.
But no computation?

Is this the correct way to go? Do I miss something here?

I am using Win10, Slicer 5.8.1

Thanks for your support!

Best,
Markus

Actually you do not need to use DeCAL for DeCA. All of the steps you mention can be accomplished in the DeCA. DeCAL is specifically for creating dense landmark sets that are constrained by anatomical landmarks and create an 3D atlas. Users of this module would usually run these landmarks using GPA module

DeCA would do all of this automatically. But since you already created your atlas, you can make use of that in DeCA (with the option load atlas, instead of create atlas) and continue the analysis.

Let’s first make you are indeed running the latest version of DeCA extension. We have updated a couple months ago. It should look like this:

Hi,

okay.
I am running: Version d8e6aa4 (2025-06-18)

I use DECA since in addition it offers to “adjust” the numbers of sampling
points (semiLMs), kind of control.

Regarding DeCAL: there is some issue while running the analysis; here
is the output of the python console:

Traceback (most recent call last):
File “/Applications/Slicer.app/Contents/Extensions-33241/DenseCorrespondenceAnalysis/lib/Slicer-5.8/qt-scripted-modules/DeCA.py”, line 603, in onDCApplyButton
slicer.util.saveNode(atlasModel, atlasModelPath)
UnboundLocalError: local variable ‘atlasModel’ referenced before assignment

I doubled-checked the input folders;
option: load atlas: atlas.py & atlas_aligned_LMs (semiLMs)

model folder: aligned_models *.py (derived from DeCAL)
lm folder: aligned_LMs (derived from DeCAL, semiLMs) // I moved the atlas_aligned_LMs from this folder to a separate folder (which is used above in the load atlas section)

To me this should be ok?

Any ideas what´s wrong here?

THANKS!

Best,
Markus

You are using the latest version. The error suggest atlas was tried to be saved before it is created, but I can’t replicate this on my end with my data.

Any chance you can share your input files as a zip archive? (you can upload them here https://faculty.uw.edu/maga/data_dropbox if you do not want to share publicly).

Dear Murat,

thanks for your support!

I moved the data to the suggested dropbox location.

Thanks!

Best,
Markus

OK. I can replicate this issue with your data. Not sure why it is happening I opened an issue and pinged @smrolfe to take a look.

1 Like

@smrolfe pushed a change that seems to fix the problem. Tomorrow, update your DeCA extension via the extension manager (if you are using 5.8.1) and give it a try.

Hi,

today I updated DeCA. Unfortunately it didn´t improved the situation.

I tried DeCA on another set of CT skulls.

Steps:

  • data of 32 skulls was processed with DeCAL, to expand the 20 fix landmarks, now in
    total 230 landmarks (fixed and semiLM merged) are available
  • atlas was also generated (but not further used)
  • DeCA: create atlas & shape analysis
    • input folder model: aligned (after DeCAL) skull models
    • input folder LMs: aligned (after DeCAL) merged 230 landmakr

Resulting error log:

Traceback (most recent call last):

File “C:/Software/Slicer_5_8_1/slicer.org/Extensions-33241/DenseCorrespondenceAnalysis/lib/Slicer-5.8/qt-scripted-modules/DeCA.py”, line 599, in onDCApplyButton

self.atlasModel, self.atlasLMs = self.generateNewAtlas(removeScaleOption, self.logInfoDC)

File “C:/Software/Slicer_5_8_1/slicer.org/Extensions-33241/DenseCorrespondenceAnalysis/lib/Slicer-5.8/qt-scripted-modules/DeCA.py”, line 557, in generateNewAtlas

atlasModel, atlasLMs = logic.runMean(self.folderNames[‘tempAlignedLMs’], self.folderNames[‘tempAlignedModels’])

File “C:/Software/Slicer_5_8_1/slicer.org/Extensions-33241/DenseCorrespondenceAnalysis/lib/Slicer-5.8/qt-scripted-modules/DeCA.py”, line 883, in runMean

[denseCorrespondenceGroup, closestToMeanIndex] = self.denseCorrespondence(landmarks, models)

File “C:/Software/Slicer_5_8_1/slicer.org/Extensions-33241/DenseCorrespondenceAnalysis/lib/Slicer-5.8/qt-scripted-modules/DeCA.py”, line 1103, in denseCorrespondence

baseLandmarks = originalLandmarks.GetBlock(baseIndex).GetPoints()

AttributeError: ‘NoneType’ object has no attribute ‘GetPoints’

In the 3D viewer only the 230 landmarks are shown, and 4 empty folders were created on
the hard disk (DeCA output folder).

Since the data (model & landmarks) are already “alinged” by DeCAL, there is “nothing” left to do for the DeCA alignment & atlas generation step which might give rise to the issue?

The previous version of DeCA was not able to handle a DeCAL generated atlas (load atlas & peform shape analysis) BUT it was yesterday possible to use DeCA with the DeCAL aligned models & LMs without the atlas (generate atlas & perform shape analysis).

Could you try the latest version with the data I have sent you via dropbox?

THANKS!

Best,
Markus

I am a little confused from your description here. It is not clear to me whether this error is generated by the data you shared with me or your new dataset.

I can run the dataset you shared with me successfully and visualize results with the updated data.

If you are still having issues, please share the “raw data” (original models and lms that you are trying to use with DeCA, not aligned ones from DeCAL).

Specifying semi-landmarks in DeCA is a new feature that is not currently supported in the released extension. If this function is important for your workflow, you’ll need to install a development version that includes it.

As things stand, running DeCAL followed by DeCA will not yield different results. That said, the error you’re encountering should be possible to track down. If you can reproduce it using the dataset you shared earlier and provide the steps, I’d be happy to help debug it.

Hi,

finally got it!:partying_face:

Troubles arise once one is working with the “merged” landmarks. Probably the
ambiguity of the “label” causes the mentioned error: AttributeError: ‘NoneType’ object has no attribute ‘GetPoints’.

The “Semi”Lms start with “label” from “0”, the “Fixed”LMs start with “label” from “1”-”20”, so there
are points with the “label” 1 - 20 twice. Probably this ambiguity causes the troubles?

Now I know this and only use DeCA with the semiLandmarks generated by DeCAL WITHOUT the initial fixed landmarks.

This workflow works now fine for me!

THANKS a LOT for YOUR SUPPORT! :+1:

So to be clear, DeCA is focused on visualizing each individual’s shape difference from the template. DeCAL is an automated landmarking tool (that allows you to combine fixed landmarks with surface based semi-landmarks through a template apporach). If your goal is to look at groupwise differences, you should run the DeCAL generated dense landmark set with GPA module and compare the means of each group to see what the differences are…

(or at the minimum look at the PCA warps, to see if there are clear separations between two groups you are analyzing).