Operating system: Windows 11 home
Slicer version: Slicer 4.13.0-2021-12-15
Hi,
I have a few questions relating to applying different segmentation method on a PET image.
- I have applied a few segmentation methods on my PET image and would like to extract features from all those segments together into a table. Please have a look at the different segments. I had to export the segments to labelmap to extract features. I was manually selecting each segment and calculating the features which takes time.
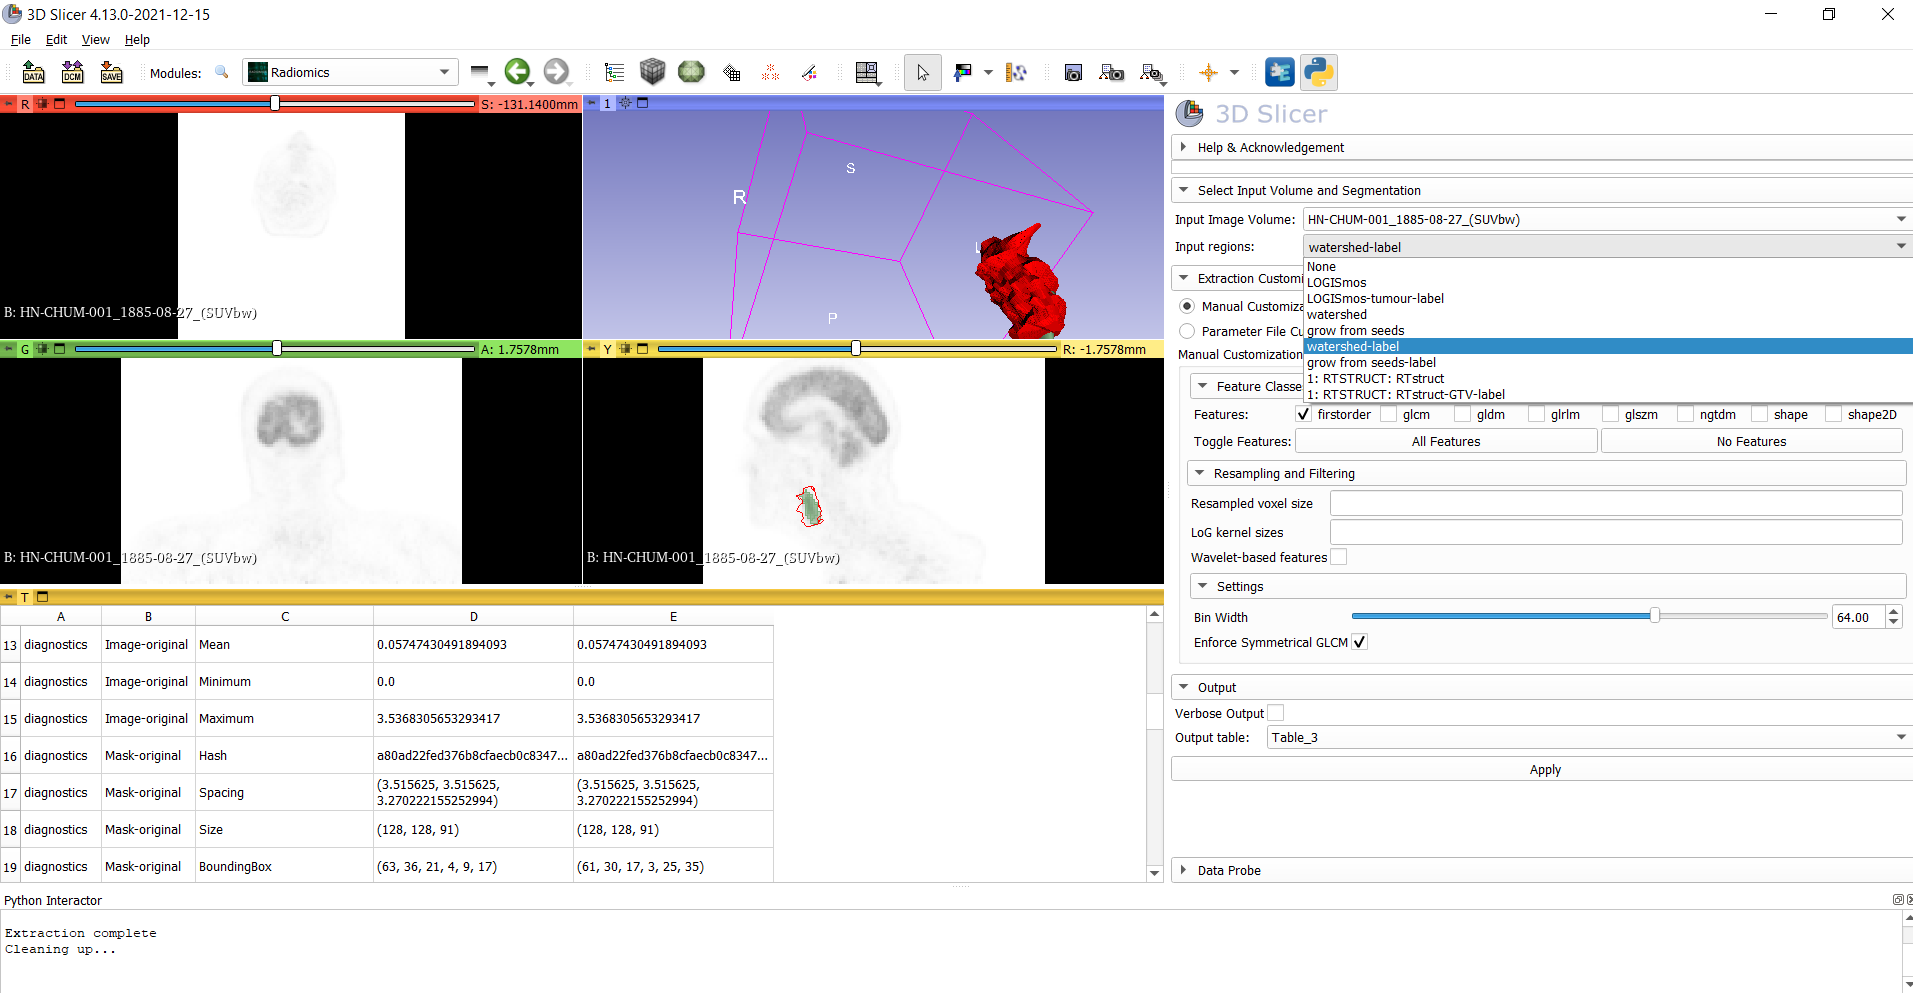
- Also while calculating segments using segment statistics module, I could see different options like labelmap statistics, scalar volume statistics, closed surface statistics and PET volume statistics. I am confused about which one to select because, in the 'input ’ > segmentation option, I can only see ‘closed surface’ segments and not labelmap.

- Is it possible to integrate results of segment statistics with output of radiomics module into a single table as I have 100 patients on which I have to repeat the same procedure and a single table for each patient would be easy to handle (calculated for all segments)
- Is it possible to see the tumours outlined using different segmentation method on the PET image so the differences in tumour outline by different methods can be easily seen?
- I would also like to know the default resampled voxel size value Log kernel size and bin width available under the ‘Radiomics’ module. I could see that 3D slicer calculates the features even if I don’t enter a resampled voxel size value.
Thanks in advance