Hi,
I’m trying to analyze my 3D gel dosimetry image ( MRI image) by using the 3D gel dosimetry analysis tool. I want to obtain a gamma index map comparing the MRI image with the dose map obtained by my tps. I didn’t receive any calibration data about my gel and so I would like to perform only a relative comparison. I co-registered the MRI image and the dose map. Then I extracted a line profile along gel volume from both the co-registered images and I have created a graph to relate MRI intensity value with Rtdose volume intensity value. I used this data as calibration equation but it seems not to work well , because there is not a univocal correspondence between the two images intensity value.
Anyone here have faced with similar problem? Maybe I have to perform something more on my images such as histogram matching or something similar ?
I’m not too familiar with MRI-based gel dosimetry, but once you have a polynomial calibration function the rest of the comparison should work the same. I guess you’ll need to plot the intensity values of the two modalities in two functions, then fit the calibration polynomial like it is done here.
@Fritta Can you paste a copy of your calibration data/plot? Maybe the coincident data (TPS profile and MR profile) are just too noisy to create a reliable calibration function. What kind of gel are you using? Can you irradiate a separate gel with a well characterized beam to be used for calibration? That would be the best way to do this to get absolute dose.
Regardless - dose profiles for a relative comparison should be sufficient. A gamma comparison is much more meaningful when you have an absolute dose. Otherwise you’re more or less just looking at spatial alignment (distance to agreement).
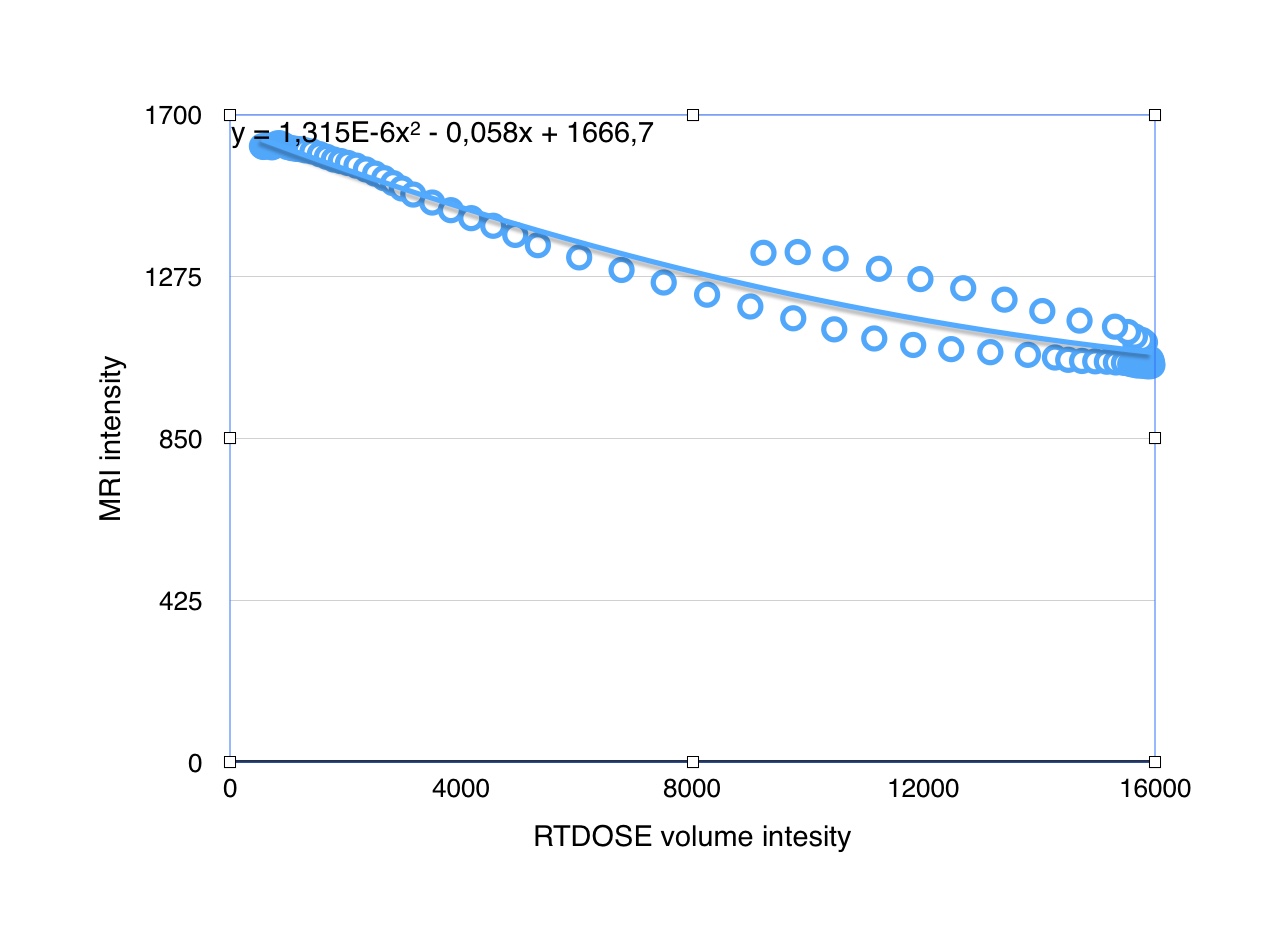
I used a polymer gel. In order to lower the noise I smooth my MRI image first … I think that the problem is that I use as input a single spin echo MRI image instead of combining the 4 series acquired at differente TE with a turbo spin echo sequence in order to generate a R2 map (is there a simple wayin Slicer to combine the 4 MRI series in order to obtain my MRI R2 map ?). This is an example of the calibration curve obtained with profile extraction
Hi Fritta
we performed some analysis on a nice product range of Gels supplied by RTSafe and I’ll loook for the abstraact /poster written.
Essentially the graph of 1/T2 is required as a function of dose or calibration. I don;t think the graph you posted contains these data, but let me know if i misinterpreted
best wishes
Rollo
RTPhysics/London.
Thank you for your reply. I’m just analyzing the RTSafe gel supplied with a 3D printed head phantom.
Thanks to a 3D Slicer tool named T2 mapping I converted the multi spin echo sequences in a T2 and 1/T2 map. Now in order to compare in relative terms the T2 map of the gel with my planned dose I need to input the calibration dose parameters into the 3D Slicer tool for gel dosimetry. To obtain these parameters I used the tool line profile : I extracted line profile values from both T2 map and RTdose volume and graph them as shown in the previous graph. Maybe I failed in something because the relationship beetween the two values profiles seems to be not in a univocal relationship. Is it correct to perform the calibration in this way?
we tried to do a separate calibration box of gel, and that was ‘noisy’.
what i am not sure of in your data is if you have found the relaxation time or one of the t2 image values. this is what kmalexander refers to in post above i think.
it is made even harder a task if you cannot easily coregister the images very well, and voxel size makes a difference.
I paste in some of the paragraphs on our poster to try and describe our process, but we concluded tha relative dosimetry worked ok, absolute was very much less certain because of the scanner characteristic and phantom temperature to name only 2 influences,
regards
Rollo
MRI data acquisition
The gel phantom was scanned in the RT treatment position at 1.5T (Siemens, Aera, body array and spine coil) before and one day after irradiation (2D fast spin echo sequence with multiple echo times TR/TE = 2000ms/36,436,835,1230ms, voxel size= 1.4 x 1.4 x 2mm3, bandwidth=780Hz/px).
Additional scans performed one week and a month post irradiation in order to investigate measurement stability.
T2 relaxation time was calculated on a pixel-by-pixel basis (Siemens workstation).
Data analysis
Pre-irradiation gel R2 =(1/T2) maps were scrutinized for imperfections and drifts in 3D and post-irradiation R2 measurements from different time points were compared.
An independent dosimetric analysis was performed in-house: Registration was performed between the CT images and the T2 maps of the irradiated phantom (3D slicer) and the TPS calculated (relative) dose was compared with the measured R2 values (Matlab R2015b).
The acquired raw images of the irradiated phantom were also separately processed by RTsafe for dosimetry.
Thank you very much for the information. Now the module seems to work well and gamma analysis start to show good results … however I have to optimize the T2-map CT image co-registration … what kind of co-registration algorithm do you suggest ?