Dear community,
I am a newbie to 3D Slicer and I’m hoping to get some advice!
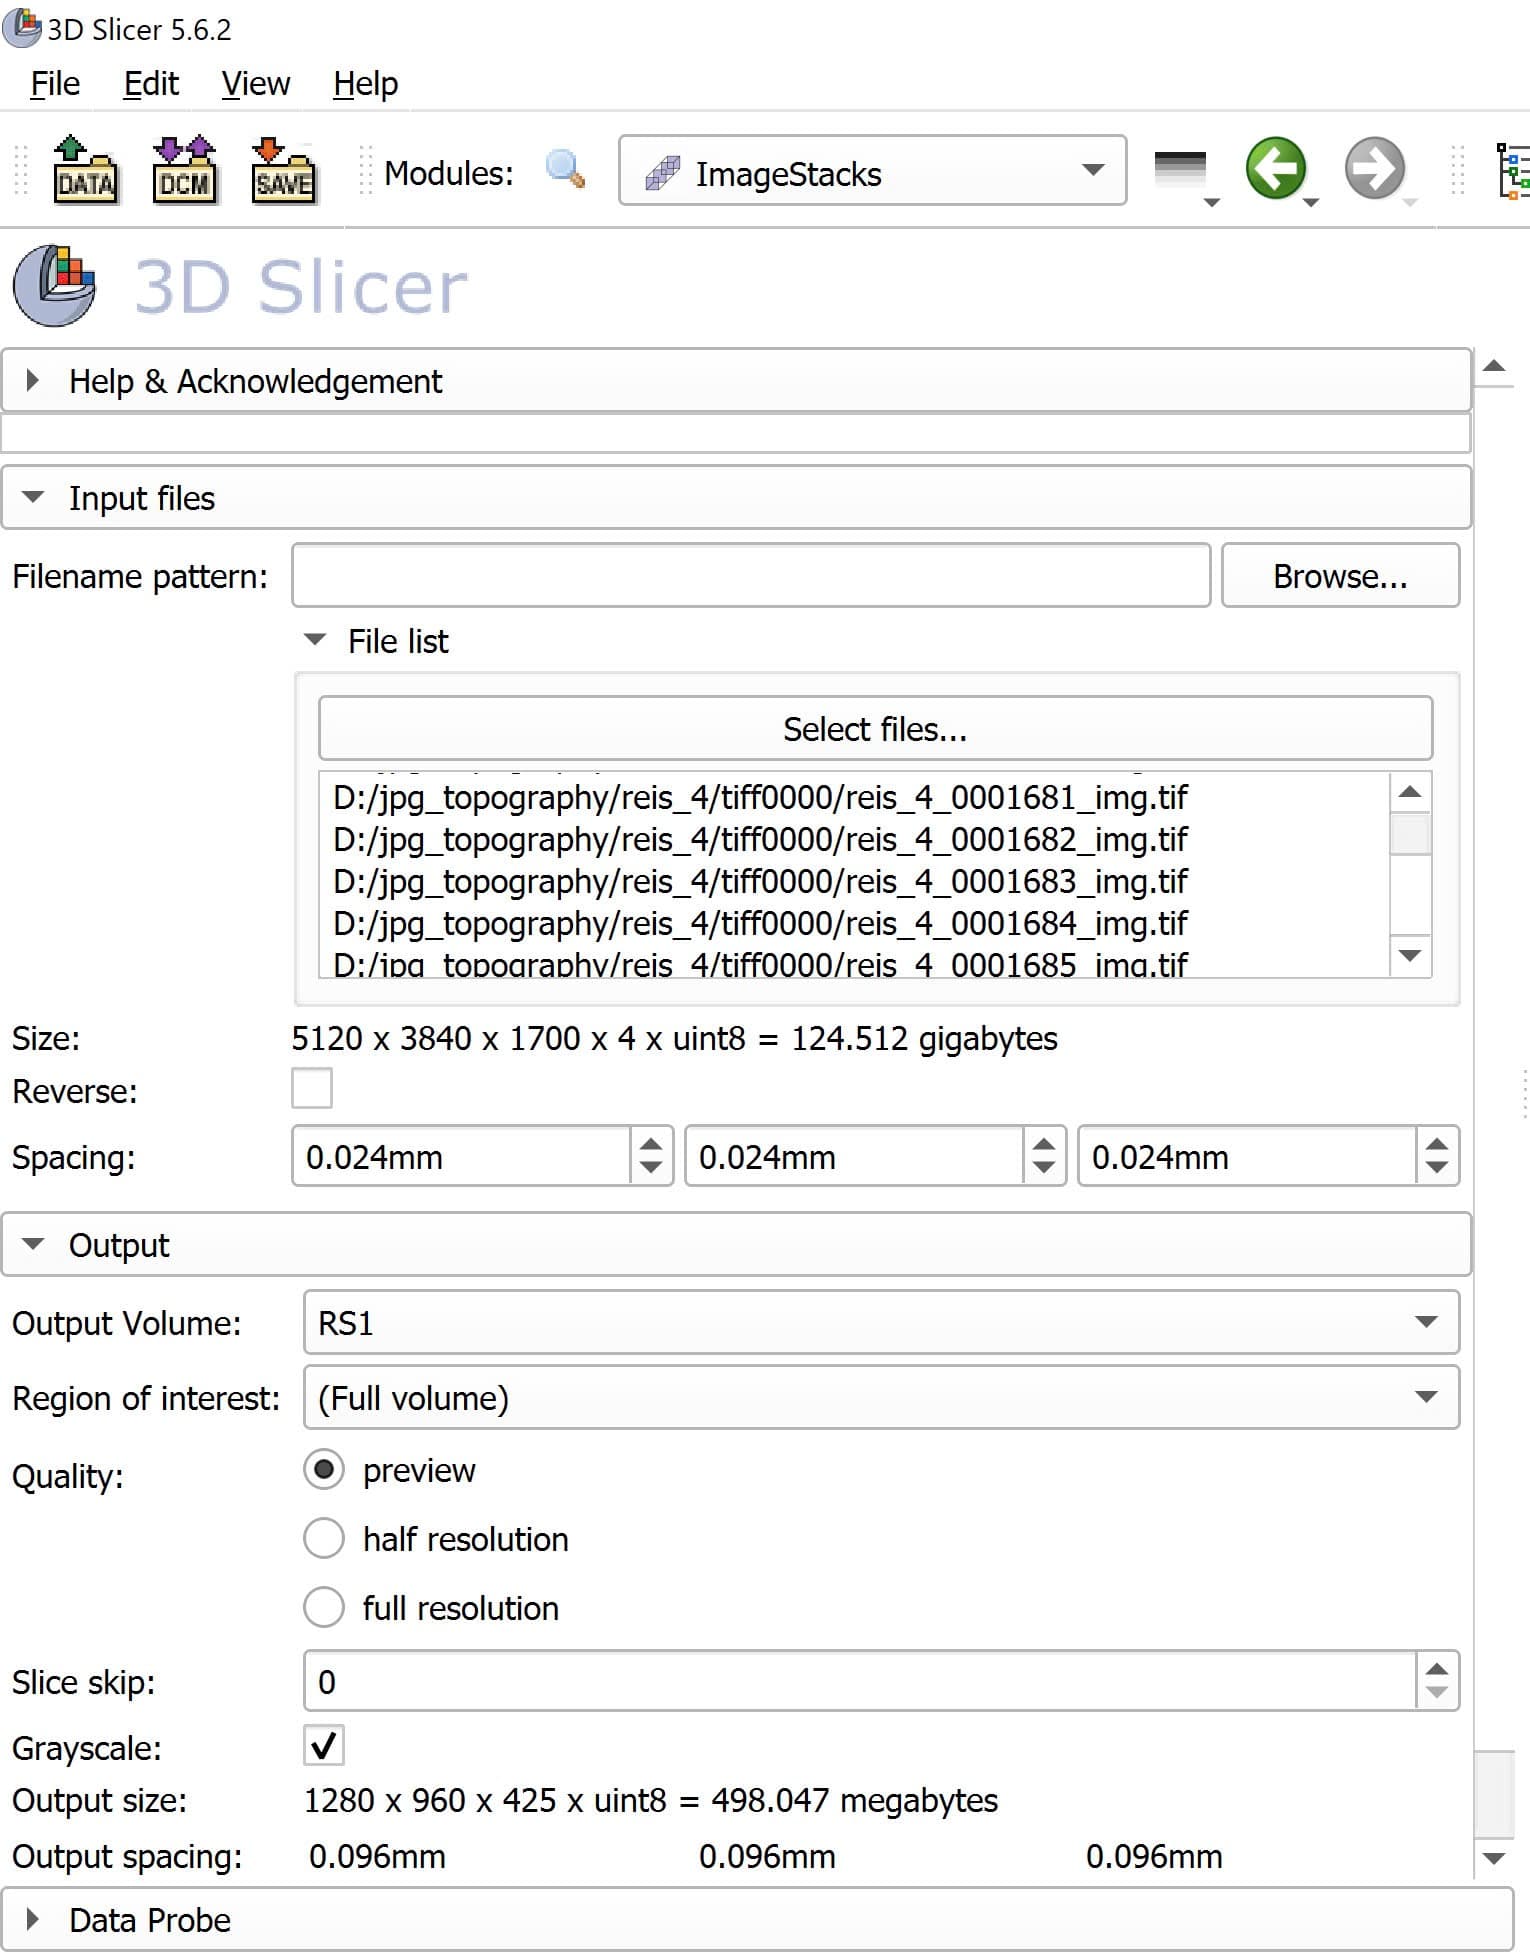
I have a dataset consisting of 1700 2D image slices (60GB total) originally in 16-bit TIFF format. I converted these to 8-bit JPEGs (400MB total) using Photoshop software for easier handling.
Using the SlicerMorph extension, I reconstructed a 3D volume from these JPEG slices (attached image). My goal is to segment this volume into regions based on intensity values:
Silica: High intensity values (210-255)
High Organic Matter: Intermediate intensity values (110-200)
I’ve attempted to use the Segment Editor’s Threshold function to accomplish it. However, the threshold value range is limited to 0 to 16 rather than 0 to 255.
Could you please advise me on how to proceed?
Any assistance you can provide would be greatly appreciated!
Best regards,
Tha’ts probably your initial problem. At this point you don’t know what happened to the intensities during that conversion.
Instead you can import the your original TIFF at lower resolution (preview option), and see what the original intensity distribution looked like. You can use this script to do that: Script repository — 3D Slicer documentation
How do you know these values correspond to those materials? Air should be just around 0.
I would just look at the intensity distribution plot and see if you can make out four peak as you expected to see, and use the values around those peaks to do my segmentation.
I have constructed a 3D volume from the original .tiff format data. However, the density range of this volume is limited to 0-15 instead of the expected 0-255 range.
It’s important to note that this density range aligns with previous research on the material of my sample.
The desired intensity ranges for segmentation are as follows:
Silica: High intensity values (210-255)
High Organic Matter: Intermediate intensity values (110-200)
If used the original data, then it means your dataset is reconstructed with those values. Slicer doesn’t do anything but the report the values stored in those files. You should really check with the lab that did the imaging why that’s the case.
You can rescale the intesities in Slicer (SimpleFilters->RescaleIntensity), but it is better option to reconstruct the cross-sectional slices with proper intensity values in the first place.
In Volumes module / Volume information section, what are the number of scalars, scalar type and scalar range values?
Do the slice views look as you expect? If you hover over various regions with your mouse in slice views do the intensity values in the data probe (lower left corner) look good?
Does everything work as you expect if you use the latest Slicer Preview Release?
The volume information section shows the number of Scalars equal to 1, with a scalar range of 1 to 15 (see attached image). The data probe’s intensity values are limited to 0 to 15, rather than the intended range of 0 to 255.
Could you kindly provide any viable answers or alternative approaches to my problem?
Thank you for your time and help.
What you show in screenshots looks more like Xray projection images rather than cross-sectional slices. Please check it the lab that did the imaging and have them give you the correct dataset.
Yes, my data consists of synchrotron-based X-ray tomographic microscopy (SRXTM) images. However, I don’t understand the difference between X-ray projection and cross-sectional slices. I have no experience in this subject; could you kindly explain it in detail for me? Furthermore, can the 3D Slicer software help me reconstruct X-ray projections?
Thank you for your time and help!
X-ray projection images are 2D images taken at many angles. These need to be run through an “reconstruction” algorithm to derive cross-section image that will help you create a virtual 3D representation of the scanned object. You can read this wikipedia topic. Cone beam reconstruction - Wikipedia
I have successfully resolved the issue with the density value display. The density values in my data were not within the expected range of 0-255 due to an error during the conversion from TIFF to JPEG format using Photoshop. I have since used a different software and successfully resolved this issue. The density values now correctly display from 0 to 255 (see attached image).
This image is a micro-CT scan of a grain sample. My goal is to segment the entire tomographic volume based on predefined intensity ranges: high values (210-255) for silica, intermediate values (110-200) for high organic matter, lower values (50-110) for low organic matter, and values below 50 for air.
However, the 3D image currently includes the sample holder. My objective is to isolate the volume of the sample itself before performing segmentation. Could you please suggest a method to achieve this?
As @muratmaga pointed out, the data you are displaying is the X-ray projection data, basically a series of shadows and what you need is the reconstructed volume data. This reconstruction step is typically performed on the scanning device and so you should be able to request this reconstructed data from whoever gave you the scan. Please follow the links that Murat provided to learn more.