I am working with dynamic PET data acquired on a Siemens Quadra PET/CT (30 frames + static CT).
I have loaded the data and segmented several VOIs based on the CT. My goal is to extract the mean PET intensity per frame (Time Activity Curve) for these segments.
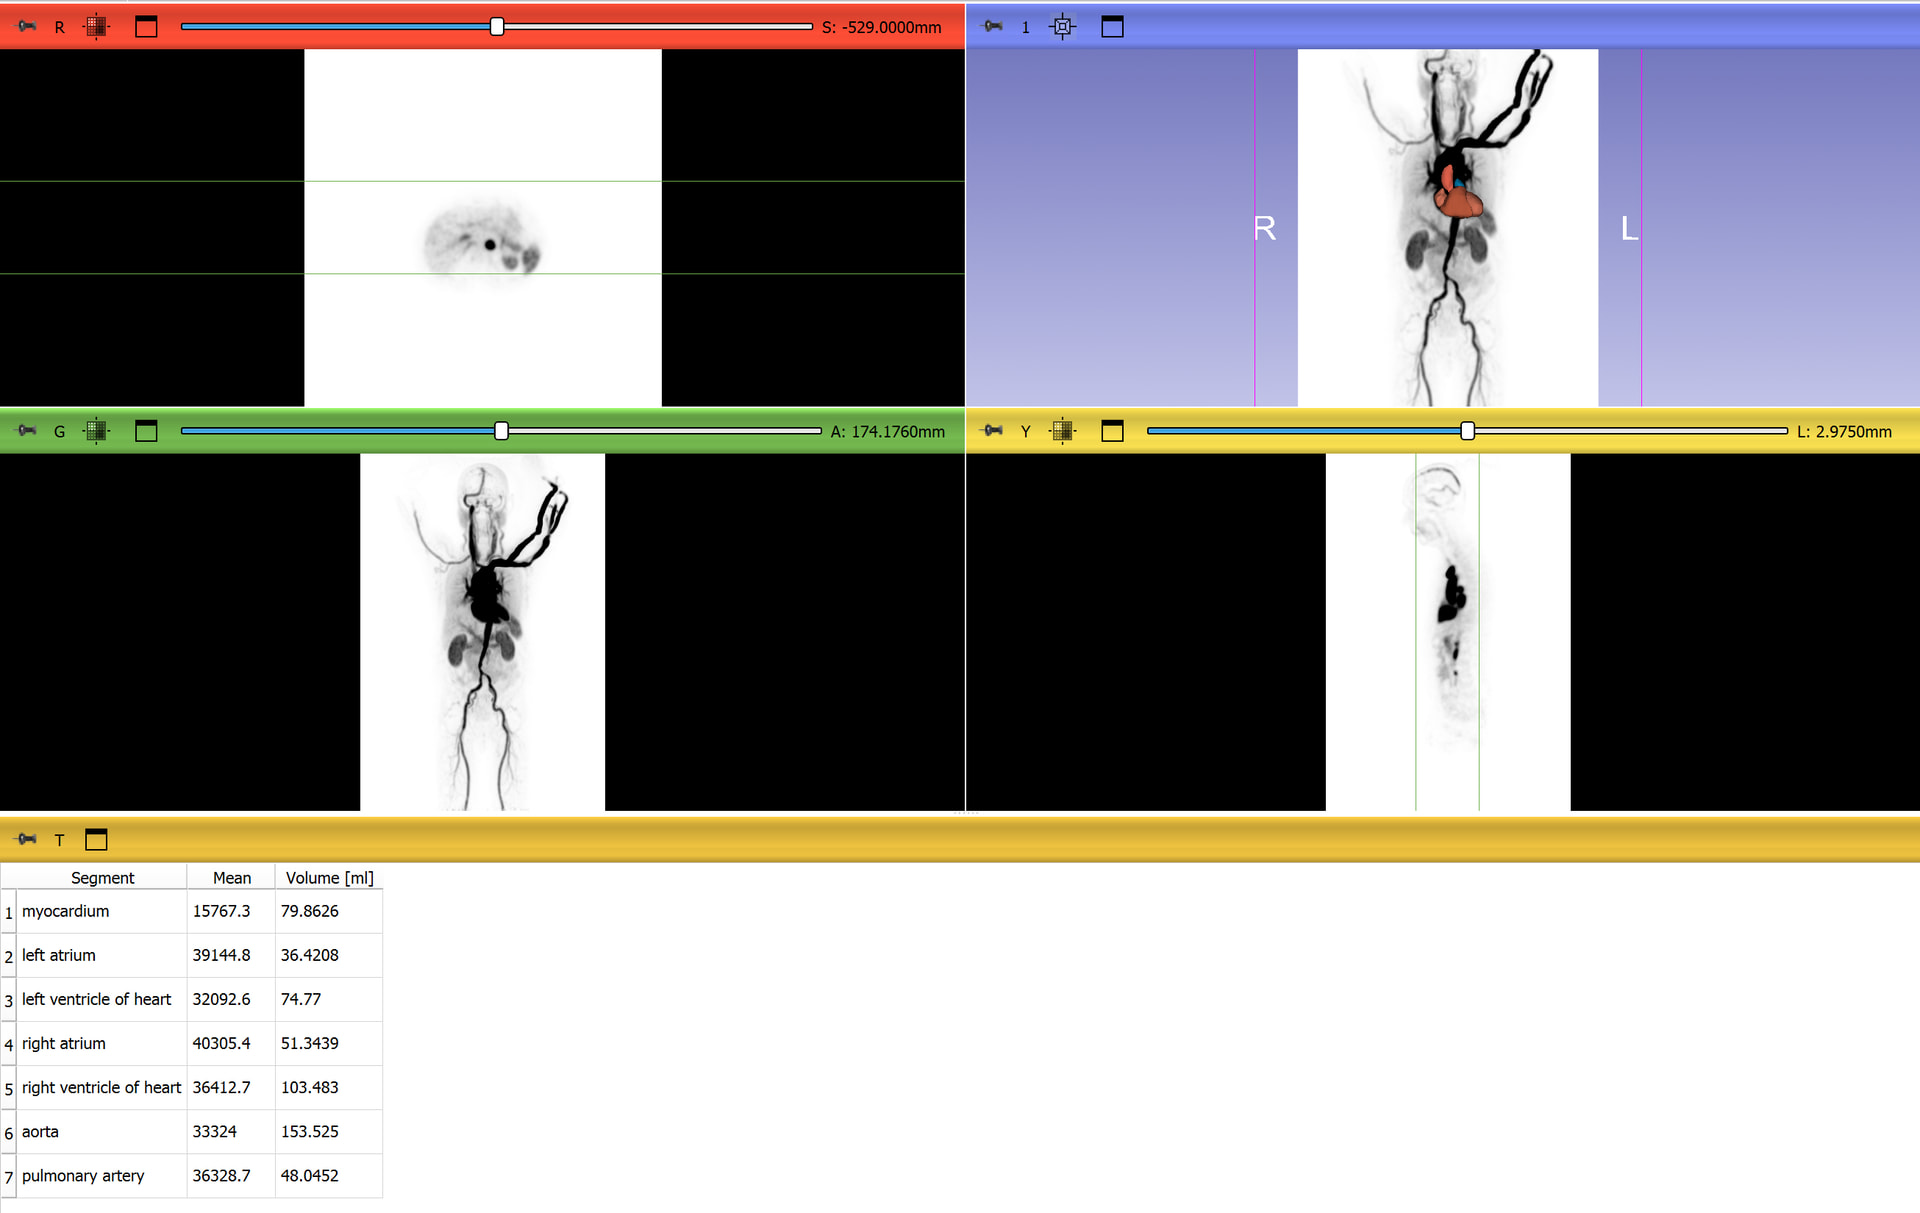
Currently, when I use the calculate statistics function, it seems to only calculate values for the currently displayed scalar volume (a single frame), giving me just one data point per segment.
My questions:
Do I need to load the PET data specifically as a MultiVolume to extract statistics across all time points?
Is there a specific module or extension recommended for batch processing these statistics across all 30 frames, or does this require a Python script?
Yes, you will need to load as multivolume sequence to be able to process all the frames. No, I don’t believe there is currently a module which calculates segment statistics across each frame of a sequence, but this is relatively straightforward to implement in a python script.
Also, this snippet from the script repository is concise and clear for a simple application of gathering volume from segment statistics module using python:
For examples of these types of things (looping over frames of a sequence, doing something on each frame, creating an output) embedded in a full module, you might find this link helpful:
Likewise, for an example of running segment statistics from python on and getting a value from it, you might find this example helpful: