I think this will depend, but it is not unexpected that larger regions will have more heterogeneity, affecting “spatial rate of change”.
You might want to generate some synthetic examples that have homogeneous regions of increasing size, or regions with the same texture. If coarseness is not constant for those regions, then either I missed something, or there is a problem in the code.
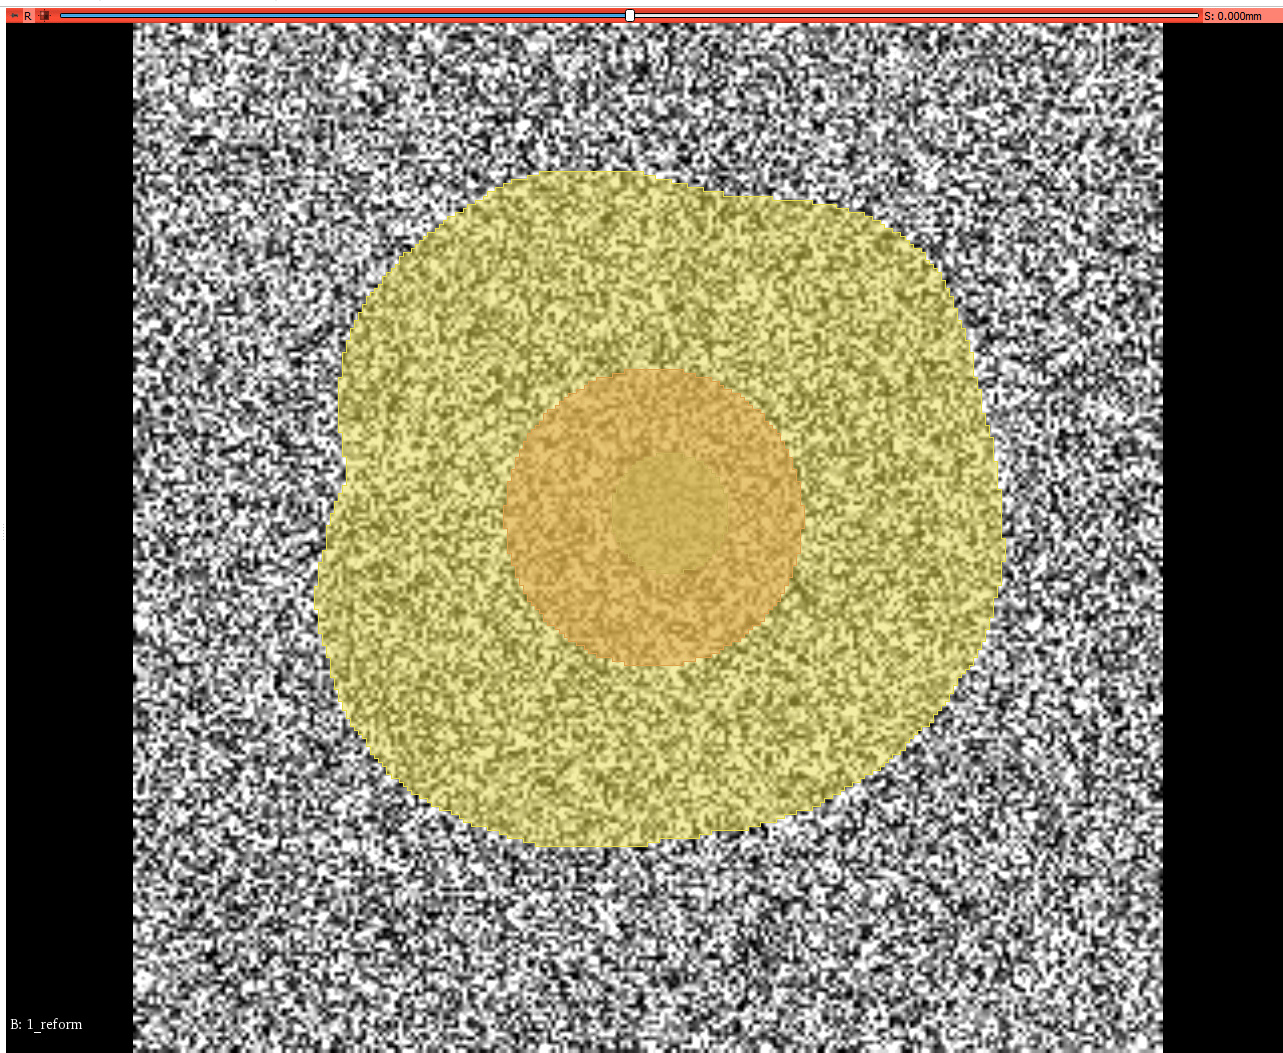
So I tested on a synthetic image (attached) with 3 ROIs of increasing sizes.
Coarseness for the small, medium and large ROIs were respectively:
0.00117546487955
0.000528825969796
0.000139595116939
Larger the ROI, smaller the values, which is consistent with my findings (T2_FLAIR Brain MRI analysis)
I did not verify yet but it seems that the glrlm and glszm _GrayLevelNonUniformity show also an association with the size of the ROI (Larger the ROI, Larger the values or Larger the ROI smaller the values if you look at GrayLevelNonUniformityNormalized)
Any insight? I have looked at the formulas but I don’t get why I observe that.
( This synthetic image is a modified image of a carpet )
@Martin_Bzr, good catch! I did not realize this before.
If you look closely at how NGTDM is defined, you can see there is a volume dependency in the calculation of s_i (sum of absolute differences between centervoxel and average of neighborhood). As the image becomes larger, this sum also increases.
In some NGTDM formulas, this is corrected by some use of N_vp (total number of voxels in ROI), but not for Coarseness (and Busyness and Strength). A potential non-volume confound variation on Coarseness would be N_vp / SUM(s_i), which would reflect the (inverse of the) average of differences between center voxel and neighborhood.
As to GLN for GLRLM and GLSZM, that is very likely, and maybe partly the reason the GLNN formula is also there.
So I have been doing some experiments on that subject today:
I have generated 30 random noise images and 30 spheres of increasing sizes.
I have extracted the radiomics features from all these ROIs and calculated the std deviation and the correlations with the number of voxel in the ROI (spearman and pearson).
You can find the csv file with the results as well as the images and the VOIs and the extraction params in the google drive link below.
I think Spearman’s correlation is more sensitive than Pearson’s for that task.
I was thinking of setting a spearman threshold based on a robust feature such as original_firstorder_Mean or original_firstorder_Median and keeping all the features that are below that.
What do you think?