How to analyze DCE-MRI data

Operating system: Microsoft Windows 7 Enterprise
Slicer version: Slicer 4.7.0 nightly build
Expected behavior: Quantitative analysis of DCE MRI and measuring parameters like K trans and fractional value
Actual behavior: Is there a way to do the quantitative analysis of DCE MRI of pancreatic tumor? I can only do semiquantitative analysis and create the plotting chart which shows the time-signal intensity curves of different ROIs, as it is discussed in this tutorial:

Thanks.

1 Like

This functionality is provided in a separate extension: https://www.slicer.org/wiki/Documentation/Nightly/Modules/PkModeling

1 Like

Thank you! I installed the extension and analyzed the data. This is the chart I got:

And it autogenerates a DoubleArray file with an extension .mcsv and it includes this result:

nolabels

0,5813.11,0
6.94764e+006,4719.33,0
1.38953e+007,4900.67,0
2.08429e+007,5255.11,0
2.77906e+007,5131.78,0
3.47382e+007,5241.11,0
4.16859e+007,5384.22,0
4.86335e+007,4986.33,0
5.55811e+007,5158.11,0
6.25288e+007,5173.11,0
6.94764e+007,5138.44,0
7.64241e+007,5346.67,0
8.33717e+007,6408.22,0
9.03193e+007,8021.33,0
9.7267e+007,9395.11,0
1.04215e+008,10528.4,0
1.11162e+008,11141.3,0
1.1811e+008,11415.9,0
1.25058e+008,11819.1,0
1.32005e+008,12122.1,0
1.38953e+008,12290.1,0
1.459e+008,13023.7,0
1.52848e+008,13199.8,0
1.59796e+008,13763.8,0
1.66743e+008,13793.6,0
1.73691e+008,14089.1,0
1.80639e+008,14338.1,0
1.87586e+008,15036.4,0
1.94534e+008,14694.1,0
2.01482e+008,14811.1,0
2.08429e+008,15017.1,0
2.15377e+008,15197.2,0
2.22325e+008,15255.7,0
2.29272e+008,15586.6,0
2.3622e+008,15690.2,0
2.43167e+008,15757.6,0
2.50115e+008,15632.6,0
2.57063e+008,15837.7,0
2.6401e+008,16271.6,0
2.70958e+008,16341.7,0
2.77906e+008,16426.1,0
2.84853e+008,15834.7,0
2.91801e+008,16637.7,0
2.98749e+008,16571.2,0
3.05696e+008,16795.2,0
3.12644e+008,16796.2,0
3.19592e+008,17083.7,0
3.26539e+008,17202.4,0
3.33487e+008,17062.8,0
3.40434e+008,17013.9,0
3.47382e+008,17579.1,0
3.5433e+008,17424.3,0
3.61277e+008,17485.4,0
3.68225e+008,17526.3,0
3.75173e+008,17495,0
3.8212e+008,17643.1,0
3.89068e+008,17620,0
3.96016e+008,17980,0
4.02963e+008,17697,0
4.09911e+008,17534.4,0
4.16859e+008,17951.7,0
4.23806e+008,18114.4,0
4.30754e+008,17758.4,0
4.37701e+008,17475.2,0
4.44649e+008,18047.6,0
4.51597e+008,18049.3,0
4.58544e+008,18114.2,0
4.65492e+008,18143.8,0
4.7244e+008,17907.7,0
4.79387e+008,18021.4,0
4.86335e+008,18113.4,0
4.93283e+008,18072.1,0
5.0023e+008,18285.4,0
5.07178e+008,18129,0
5.14126e+008,18383.8,0
5.21073e+008,18435.2,0
5.28021e+008,18395.6,0
5.34968e+008,18353.1,0
5.41916e+008,18423.4,0
5.48864e+008,18134.6,0
5.55811e+008,18456.9,0
5.62759e+008,18157.1,0
5.69707e+008,18588,0
5.76654e+008,18521.9,0
5.83602e+008,18377.3,0
5.9055e+008,18373.1,0
5.97497e+008,18445.3,0
6.04445e+008,18636.2,0
6.11393e+008,18641,0
6.1834e+008,18625.8,0

Is this what we are supposed to get? It`d be very helpful to see a module including the steps for analysis and the parameters.

Thanks.

@kirezgik sorry for the late response.

When you analyze this kind of data, you typically are interested in the Ktrans and ve maps that it produces. You can, for example, look at the changes in Ktrans to evaluate response to therapy, as done in this paper, for example (tool labeled “BWH-3D Slicer” in that paper is PkModeling).

The parameters are documented on this page: https://www.slicer.org/wiki/Documentation/Nightly/Modules/PkModeling. The most important parameters that you probably would need to change are “T1 Tissue value” (since the default is the estimated tissue value for human healthy prostate - you would need to do some literature review to see what value makes sense to use in your case) and “r1 Relaxivity Value of the contrast agent” (you can consult the referenced publication and choose the value that corresponds to the contrast agent used in your acquisition).

You should also experiment with manually defined AIF by creating a label corresponding to the vessel closest to the area you want to analyze, and passing that label as “AIF Mask image” parameter.

1 Like

Thank you for your response and suggestions @fedorov. The paper and documentation for PkModeling helped us quite a lot. We changed the parameters as you suggested and created labels using Editor module but it did not create any Ktrans map as an output. In parameters and IO section, do we need change anything? While creating labels, we labeled multiple slices, do we supposed to label 1 slice only instead?

I`d appreciate your feedback.
Thanks.

image

Looking at the screenshot you shared - it did create the output Ktrans. Did you try to change window/level?

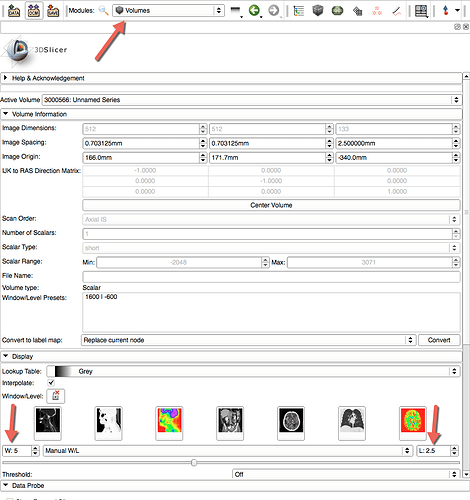
With Ktrans map the range is very small, so it can be tricky sometime to set it up properly using the mouse. You can use Volumes module to set Window to something like 5, and Level to 2.5 and see if it helps.

image

Yes, we tried changing the window level but it did not work. The biggest values for Window is 0.12 and for Level 0.05 as you can see in the screenshot below.

image

I`d like to send the link for this image file, in case you might want to test:
https://mdacc.box.com/s/1wtmtcz83b5qqb225mmbntd291n2c9da

Thanks.

@kirezgik I can’t access the file at the link you shared

image

Also, just in case you didn’t realize this - the map will only be initialized inside the ROI you prescribed. In the screenshot you shared, the ROI is covered with the label overlay. You will need to hide the ROI overlay to see the map.

Sorry, I just sent an invitation for the shared folder. You should be able to have access now.
When I hide the overlay, this is the map I can see:

image

I only see the input DICOM series in the folder you shared.

About the visualization, most likely it is just the case that you need a very narrow window to see the variation. Try moving the mouse around the ROI to get a feeling of the true range of data within the ROI. Even better, you can run LabelStatistics module setting your ROI as segmentation, and Ktrans as input image. Then adjust W/L setting based on the min/max you get from LabelStatistics.

Hi, I shared the DCEMRI KTrans map file too. Also I just uploaded a ppt which shows the steps we have been applying. There must be something wrong with either the data itself or the analysis process we are following.

Thanks for sharing the data, that really helps.

Indeed, there is a problem with the analysis.

To investigate this issue, I created concentration-converted multivolume for the dataset, and saved the fitted curve as shown below

Once this is done, these two multivolumes can be selected in Multivolume Explorer to visually evaluate the quality of the fit, which shows that indeed that fit does not make any sense.

image

At this point, I don’t know what is going on.

One thing I see immediately is that the region you marked as “blood” does not seem to correspond to a feeding artery. You should see a characteristic sharp early uptake in the blood vessel region, more like the area highlighted with crosshairs in the screenshot below. But when I try that, I don’t get results that make much more sense.

I am not sure when I will have time to investigate in more detail, but I will ask some people working with me to see if they can look into it.

Hi again!
Could you have time to investigate the issue more detailed or ask someone? We wonder if it is really related with our DICOM dataset as @malaterre mentioned in ERROR with DCE MRI loading in DICOM Browser case or the analysis route or modules.

I am pretty sure it is unrelated to the loading of DICOM, but to the analysis process. I asked @mschwier to look into this, but I don’t know if he had time…

I’m sorry, I got sucked into some other issues and forgot about looking into this one. I’ll run it through a debugger the next days and see if I see smth.

Something that strikes me as unusual in the input data: The trigger times span a time frame of more than 600.000.000 ms, which is about a week. With 90 frames the interval between two frames is about 2 hours. Is that correct?

1 Like

@mschwier indeed, this can’t be correct! That’s a good lead …

I’m trying to see smth in the debugger with the unusual trigger times in mind. @kirezgik, if you have any info about the trigger times in the data or could double check your data with regard to this, that would be great.

@mschwier I think we should figure out the temporal resolution first.

@kirezgik can you please let us know (or ask the manufacturer of the equipment) how to properly interpret the temporal resolution of this DCE acquisition from the DICOM data they generate?

Basically, when we parse DCE series, we look for certain attributes to provide information about time stamps for the individual time frames. In this particular case, TriggerTime appears to be the attribute that seems to indicate time, but it jumps from 0 to 9074472.1875 for the second time frame. According to the standard, TriggerTime units is msec, and in the case of your data it does not appear to be the case.