Operating system:windows 10
Slicer version: 4.7.0
Expected behavior: output multivolume
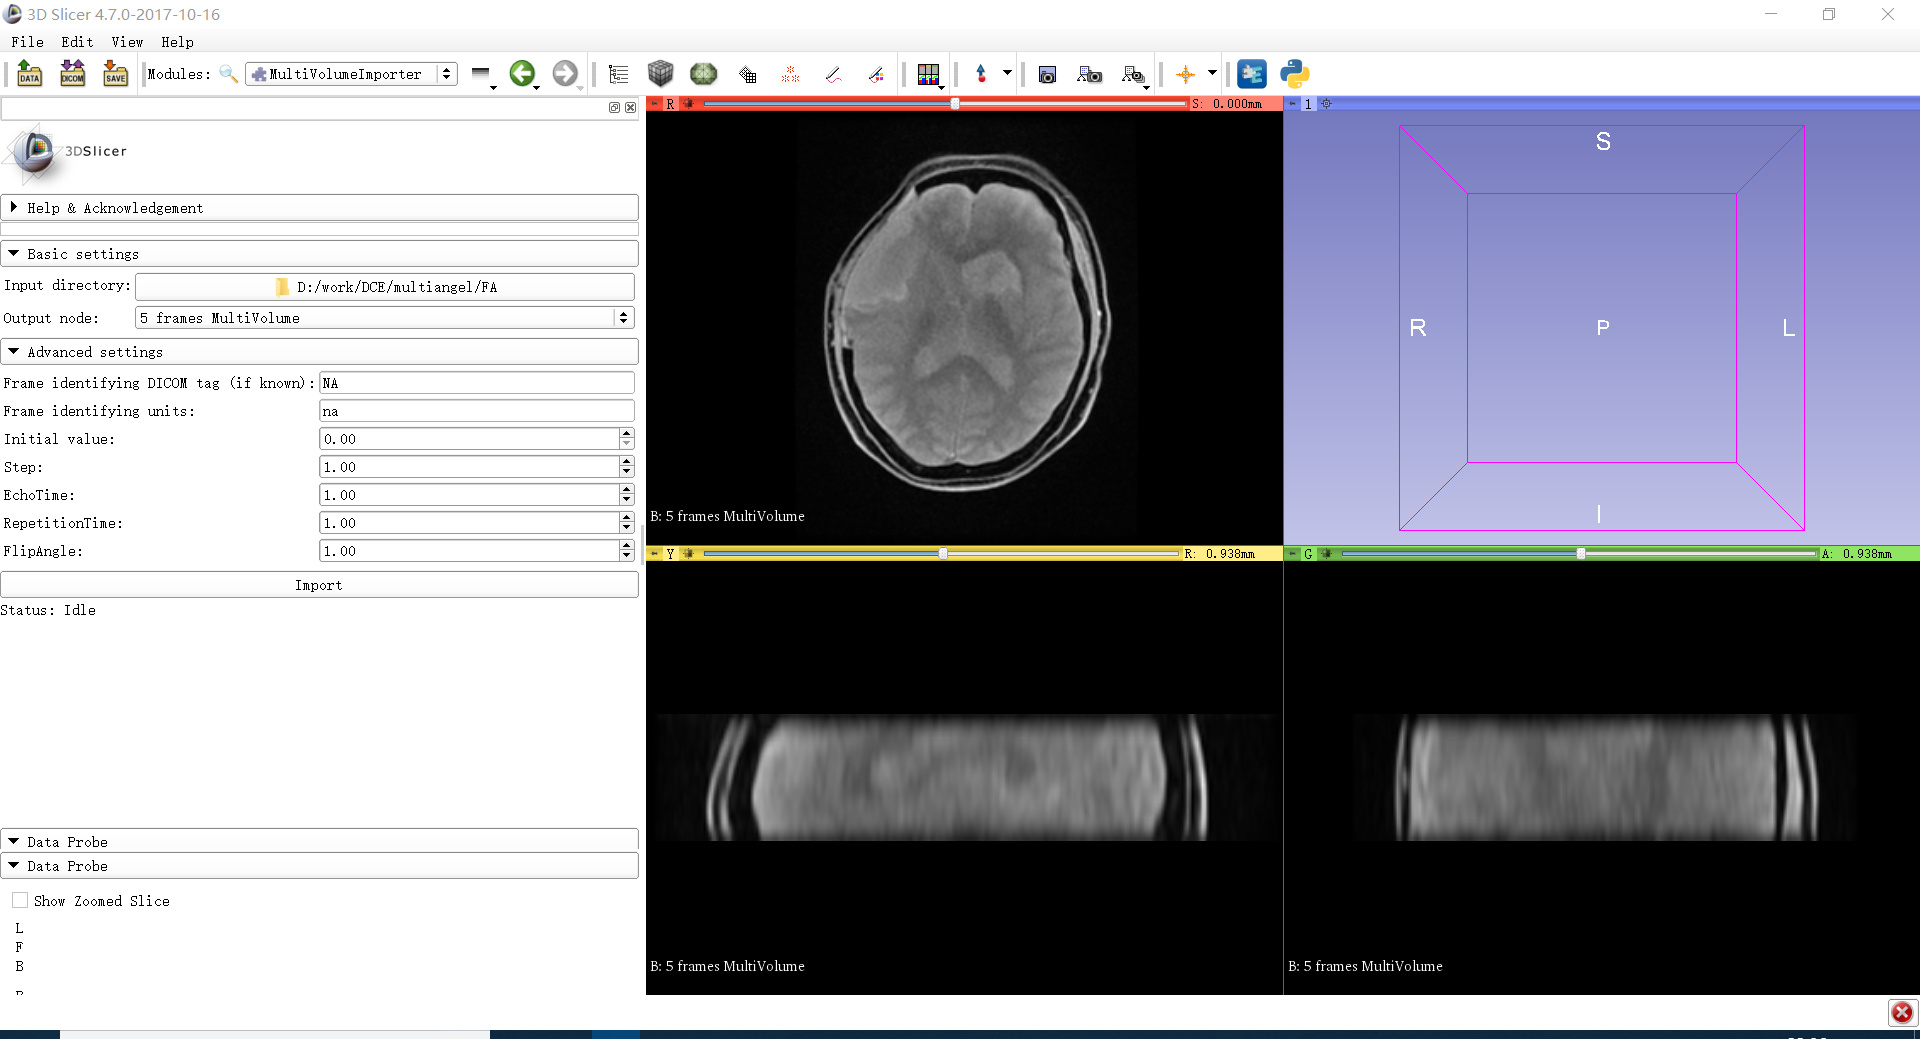
Actual behavior: don’t know how to fill the settings, where can I get those informations? Thanks a lot!
What is the format of your input data?


Glad to hear you solved the problem. It would be nice if you could post the solution so that if someone has a similar issue your post could help them.
About your new question, please include the full error log and ideally the de-identified dataset to allow reproduce the problem.
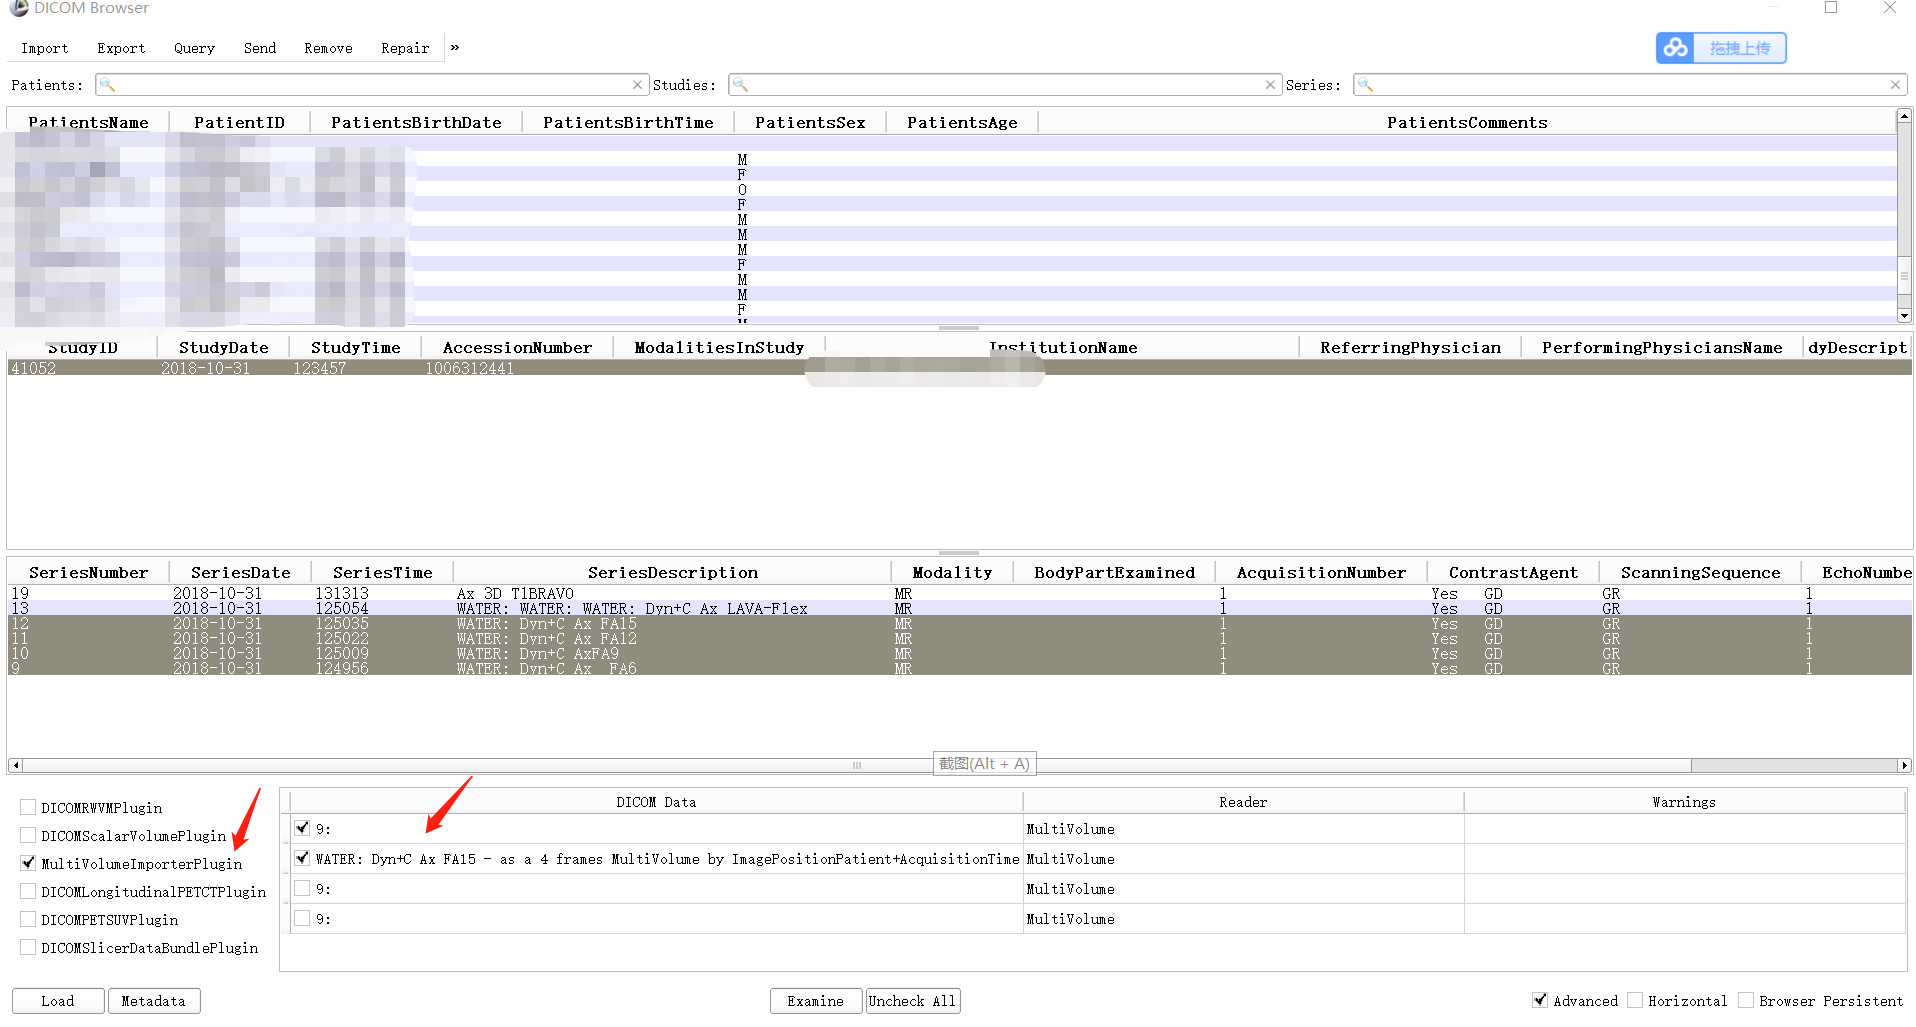
Makes sense. You should use DICOM Browser to load multivolumes from DICOM. The purpose of MultiVolumeImporter is to load multivolumes that are saved as a sequence of volumes in non-DICOM format.
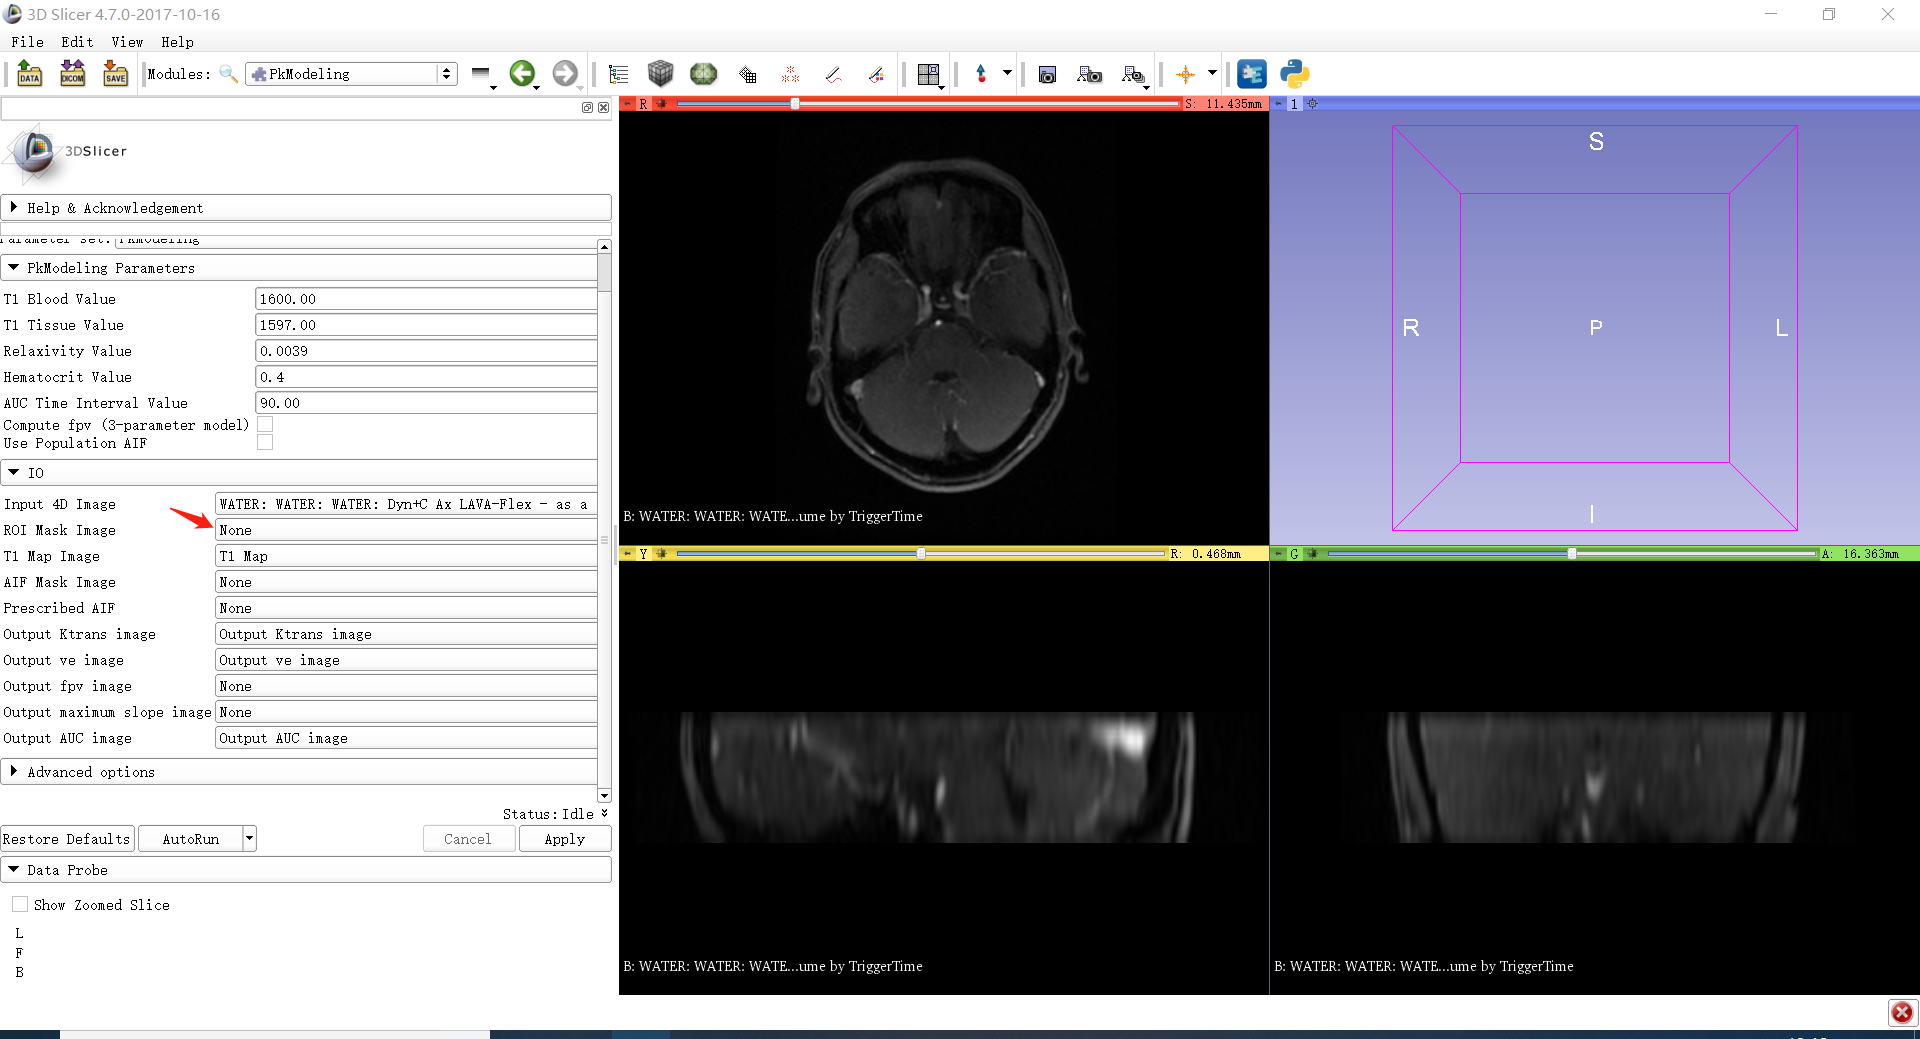
You first need to extract a single frame from the multivolume, and then use Editor module to segment the regions of interest. You can then plot curves averaged over those regions.
If you want to see curves for the individual pixels, you can do that using MultiVolumeExplorer module.
If this is too confusing, I will make a demo video later.
Thanks a lot, I will try it as you say.