Is there a feature that allows an ROI selection that will inform of basic metrics in the ROI such as median, mean, etc? I would like to select a cylinder through a volume and have the data of every slice available (eg median value in the ROI in every slice) possibly exported as a .csv.
Thanks for the reply. So I tried that earlier, but I’m only seeing metrics for the entire volume (this is like a 15 cm long cylinder at this point). Is there any way to show the slice by slice data or is this a slice by slice process if I wanted to do it this way?
To compute slice-by-slice metrics, probably the simplest is to blank out areas outside the segment using Mask volume effect (provided by SegmentEditorExtraEffects extension) and then iterate through the slices using numpy (see example).
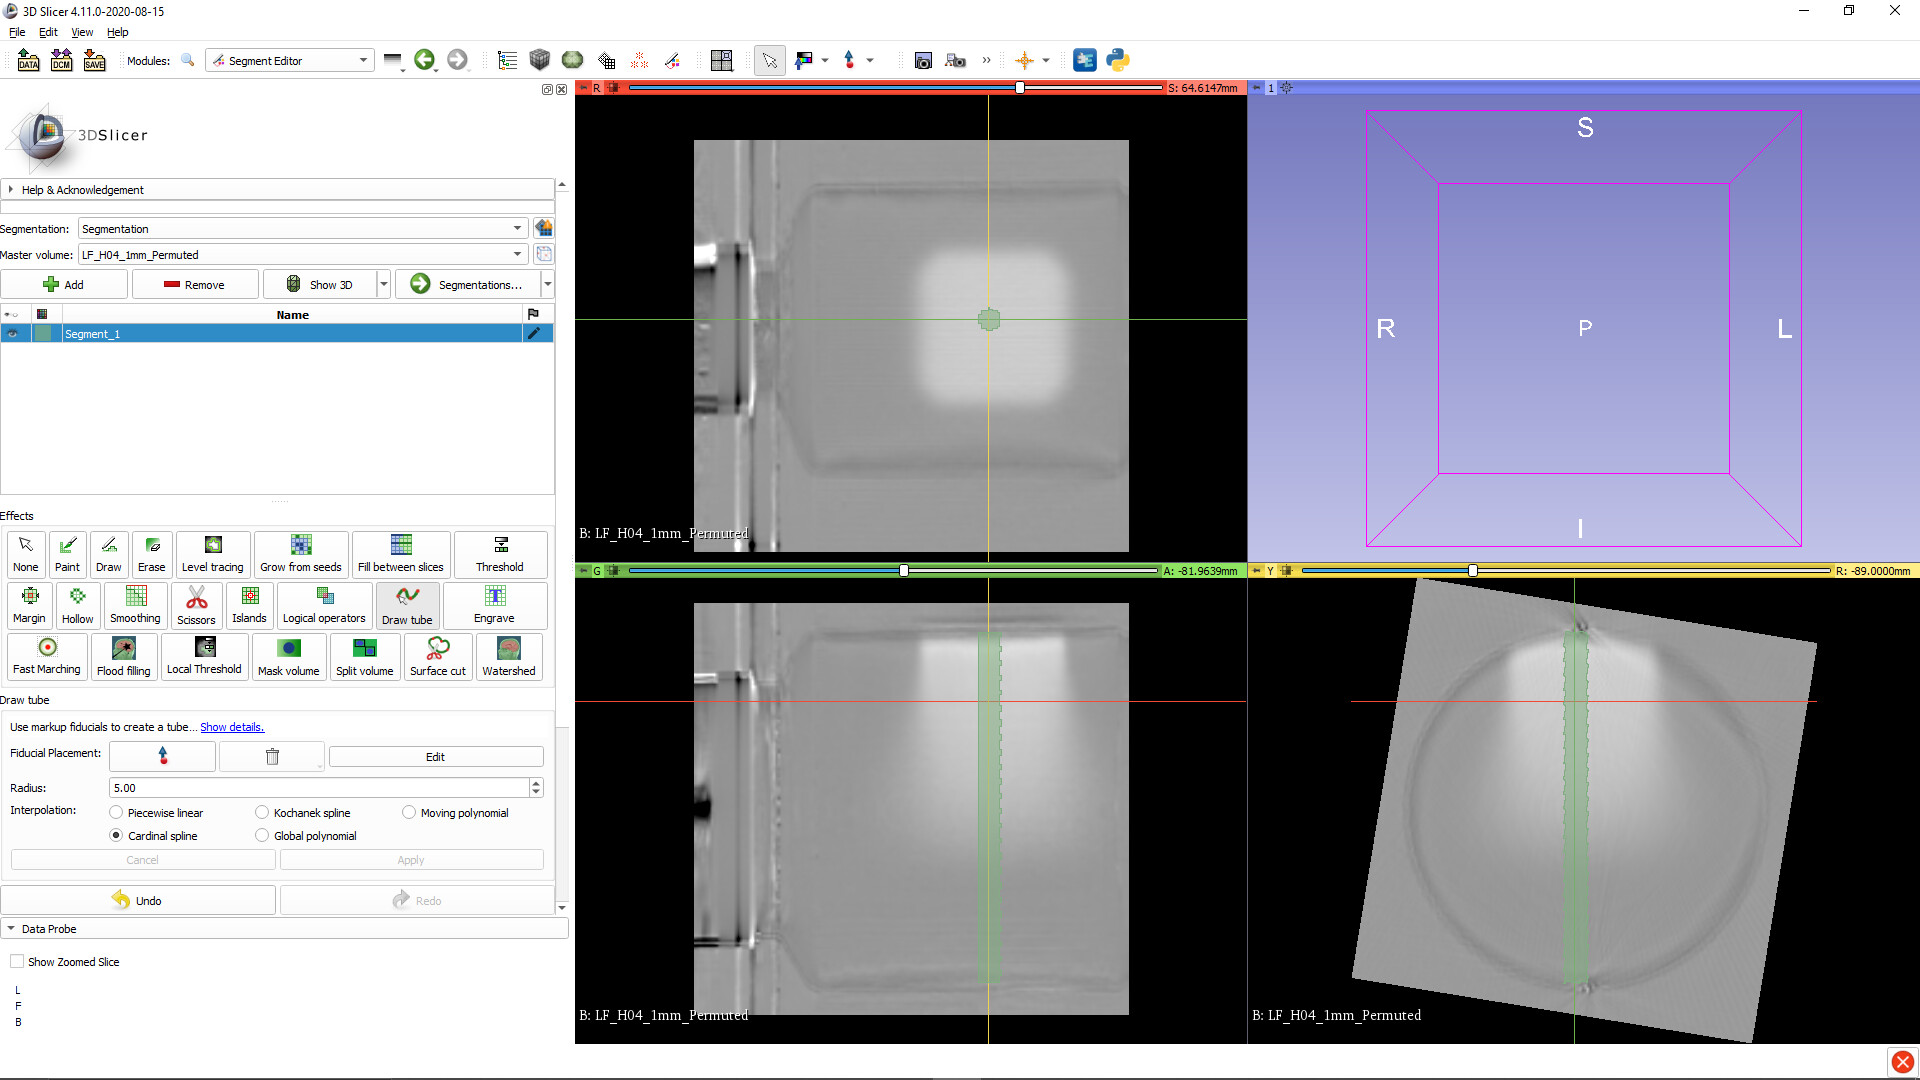
This looks very promising! I have not used any python functionality with Slicer before. With the segment created (I made a cylinder with the SegmentEditorExtraEffects and then masked out the outside of the rest so I’m left with a 1cm cylinder of segment), do I start typing in the python code into the Python Interactor Window in the Slicer application or is there a way to save this segment as data somewhere and then use Python in a separate interface? This is my first experience with anything like this, I appreciate all the help!
You can either use the built-in Python console (copy-paste code between a text editor and the console) or use a Slicer Jupyter notebook. If you need to run the code often with a convenient user interface then you can put it into a scripted module (see tutorials).
With my masked data, I now have an image of 0s everywhere except a cylinder of values. I’m not sure I’m following the documentation correctly. I am trying to follow the example code below
voxels = slicer.util.arrayFromVolume(volumeNode) # Get volume as numpy array
slice = voxels[sliceIndex:,:] # Get one slice of the volume as numpy array
My segment is called “LF_H04_1mm_Permuted masked” in Slicer. It appears that this is already a volume but maybe I’m missing something?
edit: I am able to export my transformed image (hardened), and masked as an .nrrd and just read into python/matlab. However it is not saving the rotations and transforms I had used to make the segment/mask even with a harden on the transform.
Here is the initial imported NRRD recon (Apparently I accidentally saved the rotation I made permanent to the file? Normally had to rotate this image to make it look this way):
Transform hardening on images is only performed by resampling if it is necessary (e.g., when applying non-linear transform), because resampling the image data is a lossy operation. Linear transforms are applied by changing the image geometry (image origin, spacing, and axis directions), without touching the voxel data, this preserving all information. If you want to resample the image data along axes defined by a transform then you can use one of the image resampling filters.
So rather than saving the Nrrd right after the masking step, I should resample the data so it is aligned the same way as I see in the windows? I’m not sure I see why the initial image is oriented such yet when saved and reopened in Matlab it is rotated back to it’s “original” position?
Yes, if you want to have the image axis directions to be aligned with a particular physical axis directions then you need to resample the image.
You can create a volume with the desired axis directions (see example here) and use that as reference volume in “Resample scalar/vector/dwi volume” module.
However, it is probably even simpler to start everything with segmenting the jar. You can then get oriented bounding box of the jar fully automatically from Segment Statistics module. Example script to get the bounding box as ROI node is here. If you set this ROI as input to Crop volume module then you get a cropped, resampled volume that has its axes aligned with the axes of the jar.