Extracting a subnetwork from 3D volume

Hi there,

This is a follow up to my previous post here

I’m trying to reconstruct a 3D volume from the 2D images provided in this study (image source).
Post reconstruction, I’d like to filter only blood vessels that range from 1-10 micrometers.
Side note: The input data for reconstructing a 3D volume is available in tiff format.

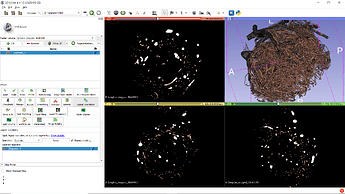
Following the instructions given in the above-mentioned link, I could obtain the following 3D volume.
image .

Next,
I’d like to generate a skeleton like the following (sample skeleton image below) from the 3D volume.

Untitled

Next, I’d like to compute the centerline distance and maximal inscribed sphere radius (MISR) associated with each segment. By segment, I refer to the line between two branching points/ branching point and a terminal point. Previously, I have had some experience to use VMTK for obtaining centerline distance and MISR for simple skeletons like the one shown in the skeleton displayed above.
The polyData could be nicely processed further into numpy array with node numbers, edge numbers and the corresponding centerlines distances and MISR’s of each edge(/segment/branch) . So I 'd like to us the output obtained (subnetwork) from SLicer in VMTK to obtain centerline distance and MISR.

In the end, I am looking for a connected network(/skeleton), which I call as a subnetwork, with around 25 segments.

Here, I’d like to ask for suggestions on how to extract the network.

  1. Should I convert the 3D volume into a skeleton and then apply the constraints to extract the subnetwork.
  2. Or, Is it easier to extract a subvolume from the 3D volume and later skeletonize the subvolume ?

The following suggestion has been offered in the previous post

If the goal is to just extract vessels of a diameter range then it is very easy to do. If you have a segment that only contains vessels then you can use the Margin effect to shrink diameter of all vessels (this will make all vessels that have smaller diameters than the erosion disappear completely) then use the same effect to grow them back to the original diameter. This results in vessel tree that contains vessels that have diameters over the margin size (or twice the margin size - you need to check the details). To remove large-diameter vessels, you first find them using the same method, then use Logical operators effect to remove them from the image.

But I’m afraid I don’t clearly understand how to do the above after obtaining the 3D volume.

I’d like to request for help to do the above.

P.S: I’d also like to know if it’s possible to do the above programmatically. The size of the dataset is large (6GB). So I’ve been trying to work on a server by launching the GUI in X terminal. Unfortunately, it’s getting really tough, the graphics freeze and it closes when there are interruptions due to work from home:( . Doing this programmatically will allow me to use screen.

I can’t comment for skeletinization and VMTK, but what @lassoan suggested above should result in something like this:
Top Original Volume (LN1 dataset)
Bottom segmentation threshold followed by margin effect (shrink/dilate operation) that left 10voxel or larger diameter vessels:
(I couldn’t find the actual voxel sizes in the data repository, so its voxel units).

Does this help?

image

@muratmaga

Thank you very much for the response. I had a chance to use the local thickness plugin in Fiji and the output obtained was similar to the second image displayed with disconnected fragments. Is there a way to remove all the disconnected fragments and retain only the segments that are connected?

If my understanding is right, the above has retained the large diameter vessels and removed the small diameter vessels. Shall we retain the small ones and remove the large ones?

Thanks a ton for your time and kind attention.

You mean like this? If so, please follow the @lassoan’s instructions above (Basically segment larger diameter ones as a separate segment (red), then subtract it from the original segment (green)

image

1 Like

@muratmaga
Thank you!

Yes, absolutely! After we subtract red from green, can we remove the disconnected fragments;
extract a subvolume (I am not sure how this can be done. For instance, VMTK offers branch clipper)
and save the resulting volume in vtp or stl format?

Thanks again for the valuable suggestions.

You can remove disconnected fragments using Islands effect; and clip branches using Scissors effect. You can save results to mesh files using Export to files.

1 Like

@lassoan Thanks a lot. I’m looking for ways to do the above tasks programmatically (in Python) and I’d a chance to go through this information provided here

This is for Jupyter notebooks, I would like to have the above workflow in a script and run it in a server.

The input will be the tiff images and the output will be the stl file. I am not sure how the clipping can be
done programmatically, so I wish to exclude that step for now.

Any help on how to set up the above workflow in Python will be of great help!

Thanks a lot

Jupyter notebook is just one way of rendering an web page that your users can interact with. It is nice because you can use the exact same technology for prototyping as for final deployment. You can display a notebook in read-only mode but still with active widgets using Voila. If you are comfortable with using Javascript, it should be quite easy to put together a html page with a data upload section, an iframe to display Slicer’s 3D view for interactive preview/editing, and a download button.

Using binder has the advantage that it is free and it takes care of starting a new Slicer docker container for each user session. However, in the worst case, startup time can be up to 1-2 minutes. So, for optimal user experience you probably want to set up your own hosting using google/amazon/microsoft cloud services.

@lasson Thank you. But, unfortunately I don’t have any experience in working with Javascript.
Can we use Slicer in PyCharm? In my case, I don’t want to visualize the graphics for this dataset. Can I simply run the commands that are executed in the GUI through command line in Python?

Thank you very much for your time and kind attention

@muratmaga Could you please let me know the commands/Plugins that have been used to obtain red and green regions? And which plugin can be used to subtract red from green?

Thanks a lot

Yes. You can either use it with SlicerDebuggingTools extension, or you can use it via Jupyter notebook interface.

You can edit/run Slicer using notebook or debugging interface in Visual Studio Code, too (I just tried this yesterday and it worked well).

1 Like

I only used Segment Editor following @lassoan suggestions

  1. Add blank segment and Threshold
  2. Create a blank segment, copy from segment_1 (logical operations)
  3. Shrink and dilate segment_2 to retain large segments (margin operations)
  4. subtract segment_2 from Segment_1 using logical operations.
1 Like

Could you please let me know the threshold?

Could you please let me know the margin size that was used in this step?

Dataset I downloaded from your link was binary (it was all 0s and 255s), meaning that any non-zero threshold value will give you the same segmentation. I think I put in something like 1

For margin, I entered 10, that was only to pick up something that will clear to small diameters. You should explore your datasets more carefully. Particularly you need to find the real voxel spacing.

@muratmaga
Thank you.

“the voxel size in this study (pixel size of 0.81 µm)” This has been mentioned in the paper associated with the dataset.

I’d like to know if we can use this (0.81 µm) to subtract green from red and obtain the vessels in the range 0-10 µm thickness as a result.

Kindly excuse me for the naive questions.

Yes, you should first set the voxel spacing for your volume. There are few things to be careful though. Default spacing units in slicer is mms. So 0.81 micron would be 0.00081mm. There are some down sides of working with such small numbers. So you should either:

(1) increase the precision of length unit from the default 3 to 8 or something.
(2) change the default length unit to micron.

Both of these can be set under Edit->Application Settings ->Units. (Enable the advance option for 2).

You need to do these before you import your data.

If you are using ImageStacks from SlicerMorph to import this data, select the entire sequence of images you would like to work with, then enter the spacing information (either in mms, or micron, dependning on your preference above) and then choose ‘Downsample’ (since you seem to be running out of memory).

The resultant volume will be reduced by 2 in each axis, and then the voxel spacing will be adjusted accordingly (1.62microns).

When you specify the margin size during dilate/shrink operation, you can choose 10 micron as the size (if that’s what you want to remove) for the second segment. This operation will remove anything less than 10micron in diameter (I think, as @lassoan indicated you need to check this for yourself, and experiment). So this segment will contain only the vessels that are larger than specified size.

To retain only the small diameter ones, subtract this from the first segment which has the all the vessels, and the remaining ones should be the vessels you want to isolate…

1 Like

I change the settings using advanced option.

I couldn’t install/find the SlicerMorph extension, so I continued with the usual procedure to load the data. File > Add Data.

After the data is loaded, I am not able to see the image slices in the RYG panels on the right. It shows the image is out of frame.

I am not sure why this occurs.

SlicerMorph is only available for preview versions (4.11). You must be using the stable (4.10.2). In general switching to the preview, you will have other benefits (as in improved and added functionality)

1 Like

@muratmaga I installed preview version 4.11. Unfortunately, volume rendering wasn’t successful.

/Slicer-4.11.0-2020-05-19-linux-amd64/bin/SlicerApp-real] exit abnormally - Report the problem.

Also, I couldn’t see the slices on the right panel after loading the files using ImageStacks.

Could you please let me know if the issues reported above are due to the following error?

I am accessing Slicer installed on linux server through Mobaxterm. I am facing same problem with the stable version too. Please let me know if I should open a new thread for this issue.

I don’t encounter the same issue while using Slicer on my laptop with Windows OS. Suggestions on how to resolve the display issue while running Slicer on a remote server will be of great help.

@muratmaga
Meanwhile, I could use the segment editor to do the following in my laptop

  1. Segment 1: Threshold range: 63 - 255 (default)
  2. Segment 2: Segment 1 has been copied in segment 2. Next, margin tab was used to shrink and grow (10um).
  3. Segment 3: Segment 1 was copied using logical operator. Again, using margin operator I tried to subtract 2 from 3.

Next, to retain only segment 3 (i.e vessel less than 10 um) , I tried to remove both segment 1 and segment 2.

But , I still find the vessels greater than 10 um (grey colored) in the volume. I would like to know
how to retain only brown colored ( < 10 um vessels) in the volume.

Thank you very much
Deepa